Get the most from your 3 Admob calls
Get the most from your 3 Admob calls
Introduction
Admob is once-again policing a limitation on the amount of times you can call Admob for a single ad-request, a policy they’re calling “app multicall enforcement”. Although unofficially enforced for two years, the rumor mill has validated late this month they will be (re-)establishing compliance for publishers making multiple calls to Admob.
This article is designed to give you some high-level tips on how to retain maximum value from Admob’s revenue contribution while still adhering to this policy.
![]()
Why is this a policy?
Although speculation, Occam’s Razor indicates a simple economic reason for this policy. Ad buying isn’t easy and it isn’t cheap. The buyers on Admob face a huge influx of incoming traffic (QPS) which is very expensive to process at volume. By decreasing the QPS Admob can decrease the cost (and increase the ROI) on Google buyers, increasing throughput and efficiency of their network.
1. Choose the right price floors
Floors are essentially your method of market-segmentation, too high and you introduce inefficiencies and waste one of your ad requests, too low and you leave money on the table. Thus, the proper price floors are imperative to your strategy.
a. Grouping: Create the Correct Cohorts
- The market doesn’t compete universally: In an ideal world every buyer would have equal access to your traffic. Alas as residents in the walled-gardens of ad-tech we’re forced to bridge the gaps of technology and policy that permeate the market. And because technology doesn’t allow/reward complete customer granularity creating cohorts of ad traffic is necessary.
- A single strategy doesn’t do well: To create the correct groups of traffic you need to group traffic into like-performing yield curves. Don’t treat all traffic the same, or you’ll have 30 price points, all competing in the same way for iPad in Palo Alto to the Android in India.
A single yield model is at best inefficient– at worst it’s leaving money on the table. Now it’s against policy.
Why make multiple calls? Although the theory behind price-floors in your mediation strategy is too broad to cover in this article, the short version is: by creating price-floors amongst your networks you can segment your traffic and create more granular competition – driving up prices and increasing your yield. Further reading: breaking down average-buying
b. Flooring: Choose the Right Price
- Create scarcity & segmentation: While floors can drive scarcity, initially they can also be used as targets for cohort segmentation. That is, increasing competition among buyers otherwise hampered by averages.
- Don’t set-and-forget: Floors shouldn’t be static – the market changes, so should your cohorts. While too many changes confuse buying algorithms and hurts performance, you sell your inventory short by letting prices go stale.
What we do
Grouping optimal cohorts – We create cohorts out of like-performing inventory. In the example below, note how the CPM (x-axis) and the revenue contribution (y-axis) of two different countries are very similar. These would be prime examples of countries that could be grouped into the same monetization cohorts.
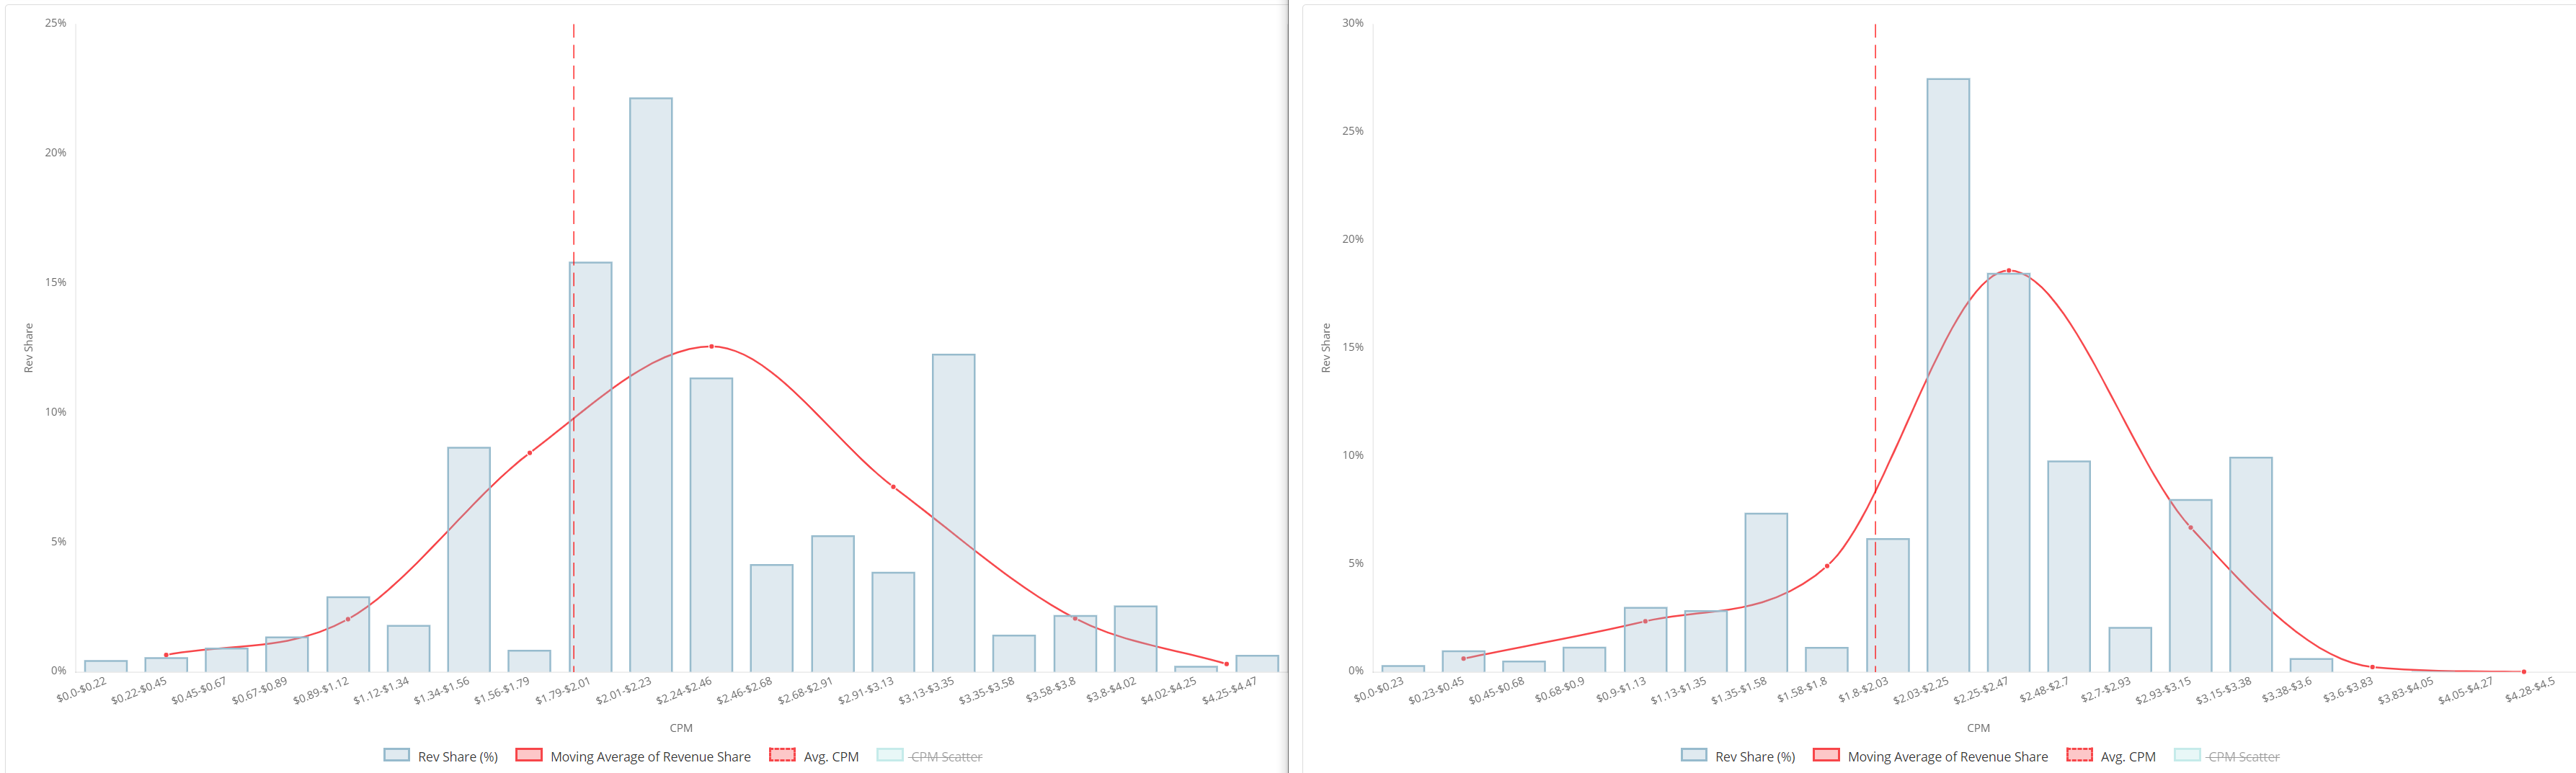
What am I looking at? The revenue distribution chart is our method of analyzing the existing & potential revenue & impressions share of a yield curve over time. Further reading.
Create the optimal array of floors – As market-prices change you’ll want to take advantage of swelling demand and maintain efficiencies during market-slowdowns. We prefer collecting an array of floors that we can easily introduce to the market measuring performance to indicate success.
What am I looking at? While no yield curve is a perfect Gaussian Distribution, it’s often a solid frame-work for establishing target buying positions. Buying grouping & doldrums indicate opportunity for increasing competition.
2. Measure Performance. Then act.
“Performance” is the indicator that will drive the bulk of your decisions for optimization – unfortunately is much more complicated that the highest buyer for your inventory (CPM).
Key Performance Indicators
- Fill-rate: Or more correctly “Ad Attempt Rate” the fill rate is the number of ad requests filled by an impression – this is an important indicator of market demand for the price-floor you’ve established. Too low and you’re introducing inefficiency, too high and you’re leaving money on the table.
- Cohort Revenue Contribution: An oft-overlooked metric, the revenue contribution is the percentage of cohort revenue generated. While fill rates are a measure of demand, in a market with low demand the revenue contribution metric should override low fill rates to avoid blindly killing off important revenue contributors.
- Revenue per Request: This is far more accurate than a simple CPM – this is the revenue generated per individual ad-request. A high CPM for overall performance is nothing with low fill. The revenue generated on an ad request is critical.
What we do
Choose the Optimal Algorithmic Yield Model – Factors like pre-caching, app-type, ad unit type, and demand partners enabled all play into a strategy on what factors are important in choosing the correct algorithms to execute a Yield Model of optimization; more aggressive will allow lower fill rates while a conservative model will enforce efficiency concerns.
Using Algorithms to Act – We’ve created cascading optimization algorithms that comb through the cohort’s price points and make decisions based on the balance of inputs described above. While there are some best practices considerations we’ve established through our many algorithmic iterations — one constant is no matter how many versions of machine-assisted optimization created, they’ll always be the need for special configurations.
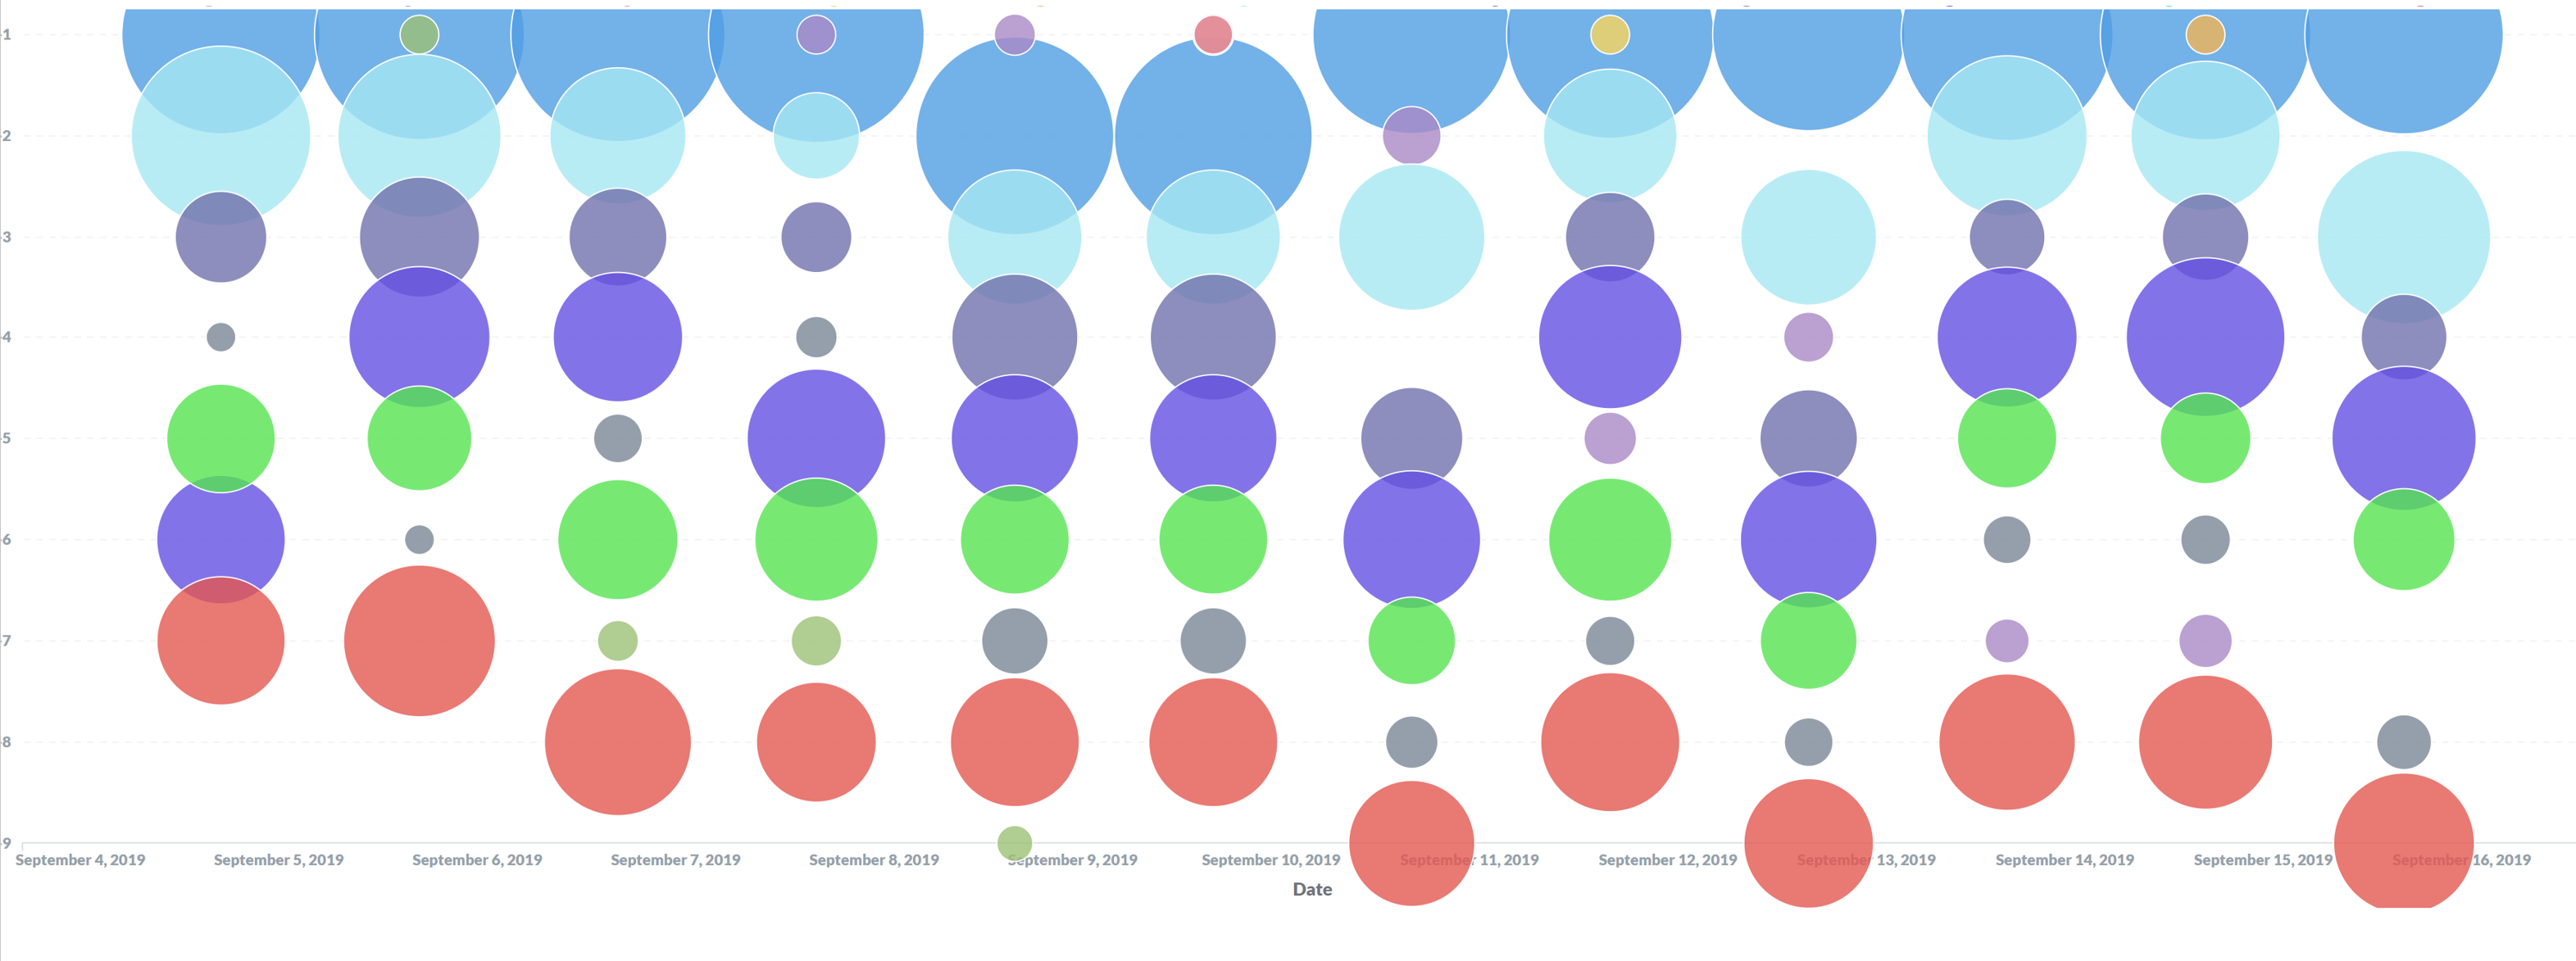
What am I looking at? Visualizing an algorithm is difficult, especially one as advanced and dynamic as the ones we employ — above is a visual estimation of a mediated cohort over time. The colors indicate line items, the y-axis indicates serving priority and the size of the bubbles indicate allocated traffic. You can see the shifting of the cohorts priority as the smaller “price tests” are introduced and either grow or are displaced and removed from the stack. This graph was generated using our analytics reporting available for all AdLibertas customers.
3. React to market changes: test & iterate.
The market fluctuates, you need to measure and react to ebbs and flows or you’ll miss the highs and create inefficiencies in the lows.
- Markets shift: As prices increase you’ll need to be in front of swelling demand. Sometimes they are anticipated, others they come quickly and fade away as fast. While market conjecture is twenty-twenty in hindsight reacting to current events needs to be fast to be effective.
- Create fair tests: Buyers are mature enough to have developed solid indicators on your traffic, they know good from bad and therefore it’ll be impossible to judge their actual performance potential by feeding them poor traffic. Giving them appropriate quality traffic is necessary to ascertain performance of your price tests.
What we do
To accurately judge performance potential we’ve implemented a testing algorithm that will periodically test price points on small amounts of traffic, then if judged a potential success will ramp up allocation to become a full-fledged buying price-point in the cohort. This allows us a fair method of performance without sacrificing traffic yields.
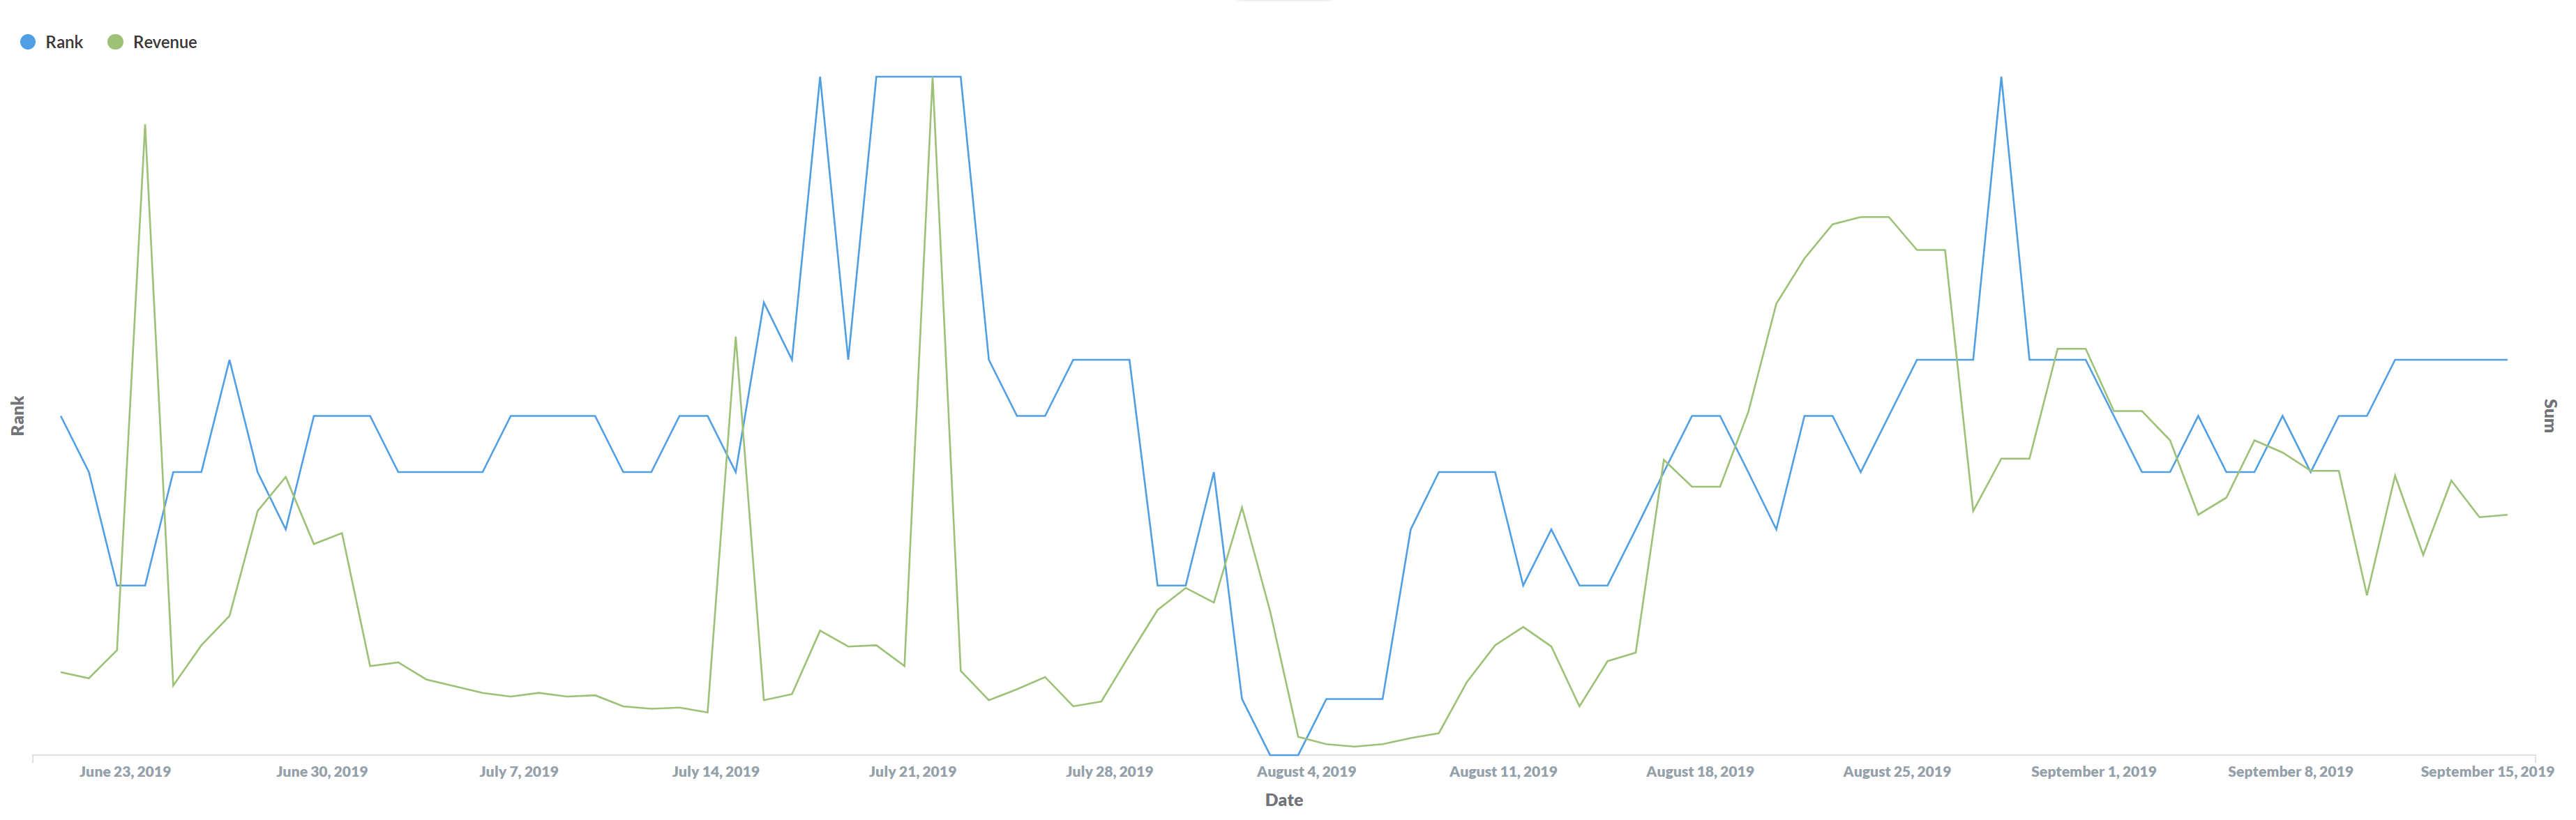
What am I looking at: when analyzing a particularly seasonal network in a cohort note how the rank (blue) fluctuates to follow the revenue (green) to capture maximum revenue of this particular buyer. This reporting is available with the AdLibertas suite of reporting & analytics.
How our customers use AdLibertas:

Making data-driven decisions: For 60 years Publishers Clearing House has been a household name. Unlike many contemporaries the once exclusive direct-to-mail company has made a successful transition to mobile.
Read how they leverage AdLibertas to maintain superiority in the complex, dynamic mobile ad market.
Maximize ROAS: Random Logic Games is a top-tier game developer who’s titles regularly sit at the top of the charts. They create fun & exciting games entertaining millions of people daily.
Learn how they use AdLibertas algorithmic optimization to maximize their return on ad spend

About us:
Curious about how to implement your optimal yield strategy? We manage billions of impressions daily – we’ve seen it all, let us help!
The name AdLibertas comes from our motto “ad victoriam mercaturae ducit libertas” — Latin for “the free market wins.” As former app-developers we’ve designed a publishers-first solution to help app developers earn more from their in-app ads. Contact us or sign-up to learn how other app developers are earning more by automating their current advertising platforms with AdLibertas.