Which KPIs should you be using to monitor your app’s performance?
Key performance indicators (KPIs) are an important part of measuring an app’s ongoing success. These metrics can be high-level obvious indicators like revenue earned, or they can be detailed and esoteric app-specific performance indicators like virtual coins spent per reward video view. The purpose of using KPIs is to track the ongoing success of users in your app.
Many of our customers tap the AdLibertas platform to build and monitor custom KPIs to track their app’s performance, and the one constant we see is an absolute variety of metrics that app developers use to measure app performance. Since one of the early questions we get with new customers is: “which KPIs would you recommend” we thought it important to write up some of the findings we’ve seen, taught to us by our customers.
First, to give a high-level segmentation of the purpose of KPIs, we find they fall into three main categories:
Marketing teams are looking to grow their app. On a daily basis, they are monitoring traffic acquisition campaign performance, looking for changes in traffic quality, cost and volume, and are constantly looking to scale back, ramp up or optimize growth campaigns.
Product teams are building better apps. They’re monitoring changes to app releases, both looking for broken technical components, or the outcome of functional changes to the app.
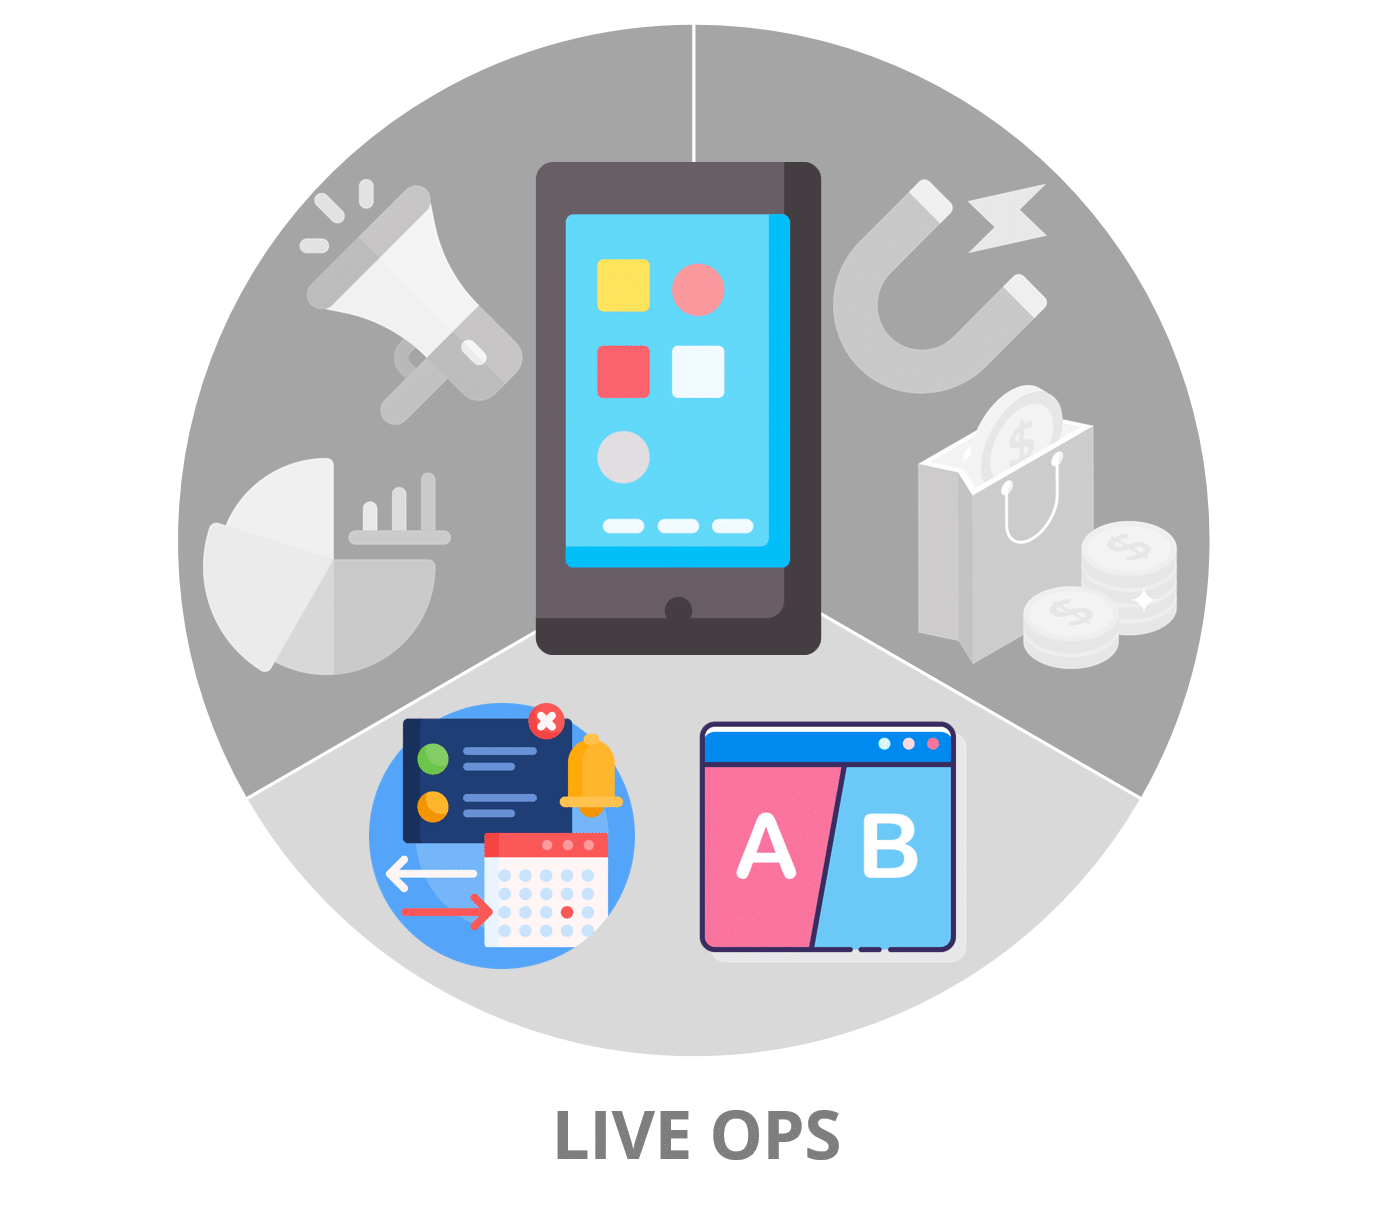
Live ops are optimizing app experience for users. They’re monitoring ongoing app iterations, looking for opportunities to improve the experience for a cohort or validate the outcomes of an AB test.

Marketing
The marketing or UA team is responsible for bringing in more users to the app. When choosing KPIs to monitor the health of these activities, these teams are generally monitoring the health of acquisition campaigns, looking for opportunities to scale up or areas they need to pare back, all while hitting install and spend budgets.
The first, and perhaps most elusive, is tracking the quality of incoming traffic. The most obvious of these metrics is the value of the users (LTV or ARPU), and even better the predicted ARPU/LTV (pARPU/pLTV) of users once they’ve matured to a certain age. But LTV can be tough to track and with small or immature groups of users, it can be a noisy signal to diagnose. At a more granular level, we also see customers looking for additional signals that can help them identify quality in other methods: games played on day one, percentage of tutorials completed, songs played-per-install, are just some examples.
Getting the updated campaign performance may seem obvious but the various methods of reporting these installs, with increasingly obfuscated campaign attribution make spend a difficult metric to get perfect. Often customers will use a segment of opt-in traffic to project results on larger groups of users. This, when combined with LTV, can give you the king of marketing metrics: return on ad spend (ROAS).
Install volume is an important metric for keeping an app growing – or maintaining—its user base. At peaky times of the year, CPIs may rise and campaign volume may fall, so a company may need to invest in lower-yielding campaigns to keep its chart position or growth trajectory. Others may want to monitor installs per region or groups of regions.
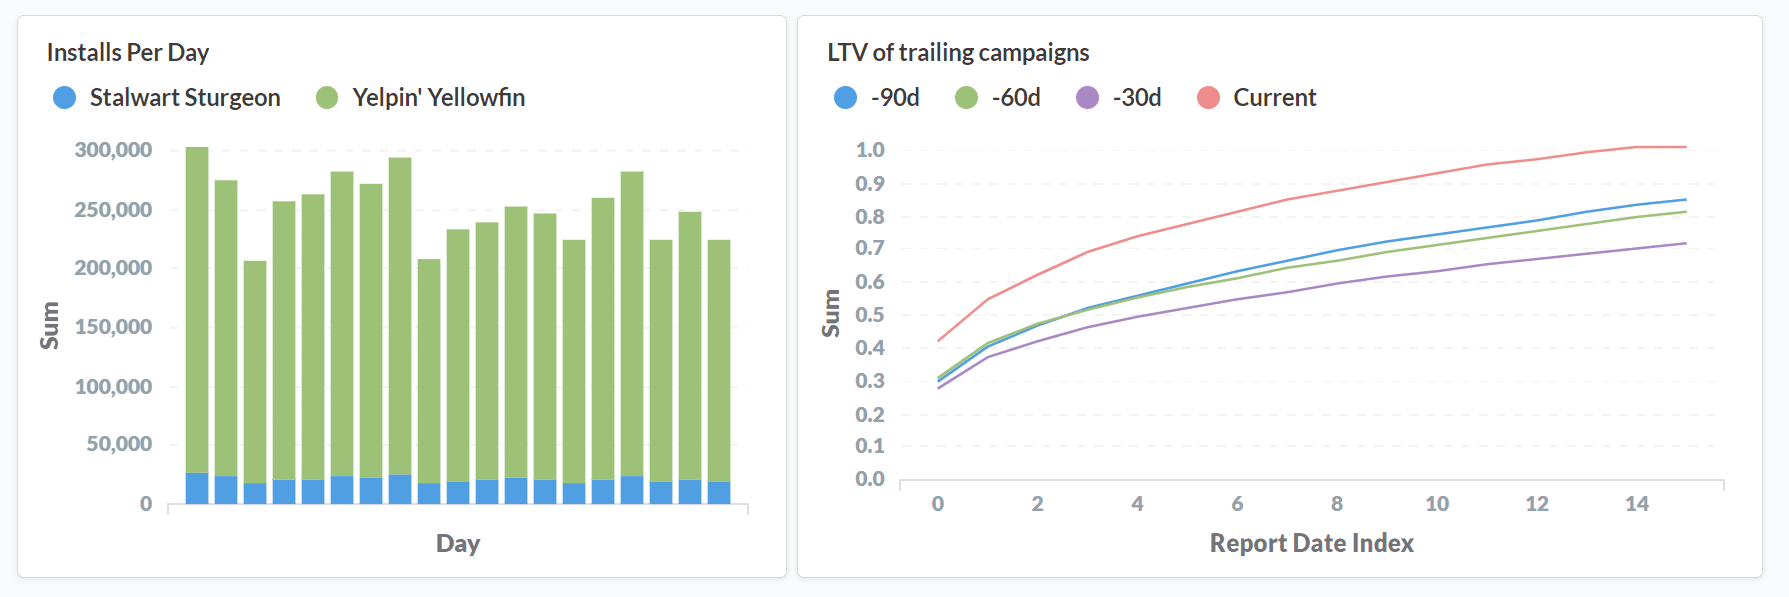
On the left: volume of installs per app.
On the right: Trailing historical LTVs for comparison.

Product
The product team is responsible for “building a better app;” this generally means increasing the engagement and retention of users in the app. Both goals are to increase the user’s engagement and retention in an app as well as increase the revenue earned (LTV/ARPU) of the user in the app.
Changes in-app function happens when the app’s underlying user workflow or gameplay changes. This can be a new feature added, a new level pack offered or offering subscriptions for the first time. Product teams will need to track metrics that indicate—preferably early as possible– the results of these changes. A great example we’ve seen used by a hyper-casual game is user time in the app per app version. For an app whose lifeblood is dependent on hooking a user on day one, are users spending more or less time in the app after the latest functional change? Less time spent could indicate users aren’t getting the same value, or the new feature isn’t generating the delight you hoped it would.
Examples: Conversions per install; sign-ups per download; levels completed per install
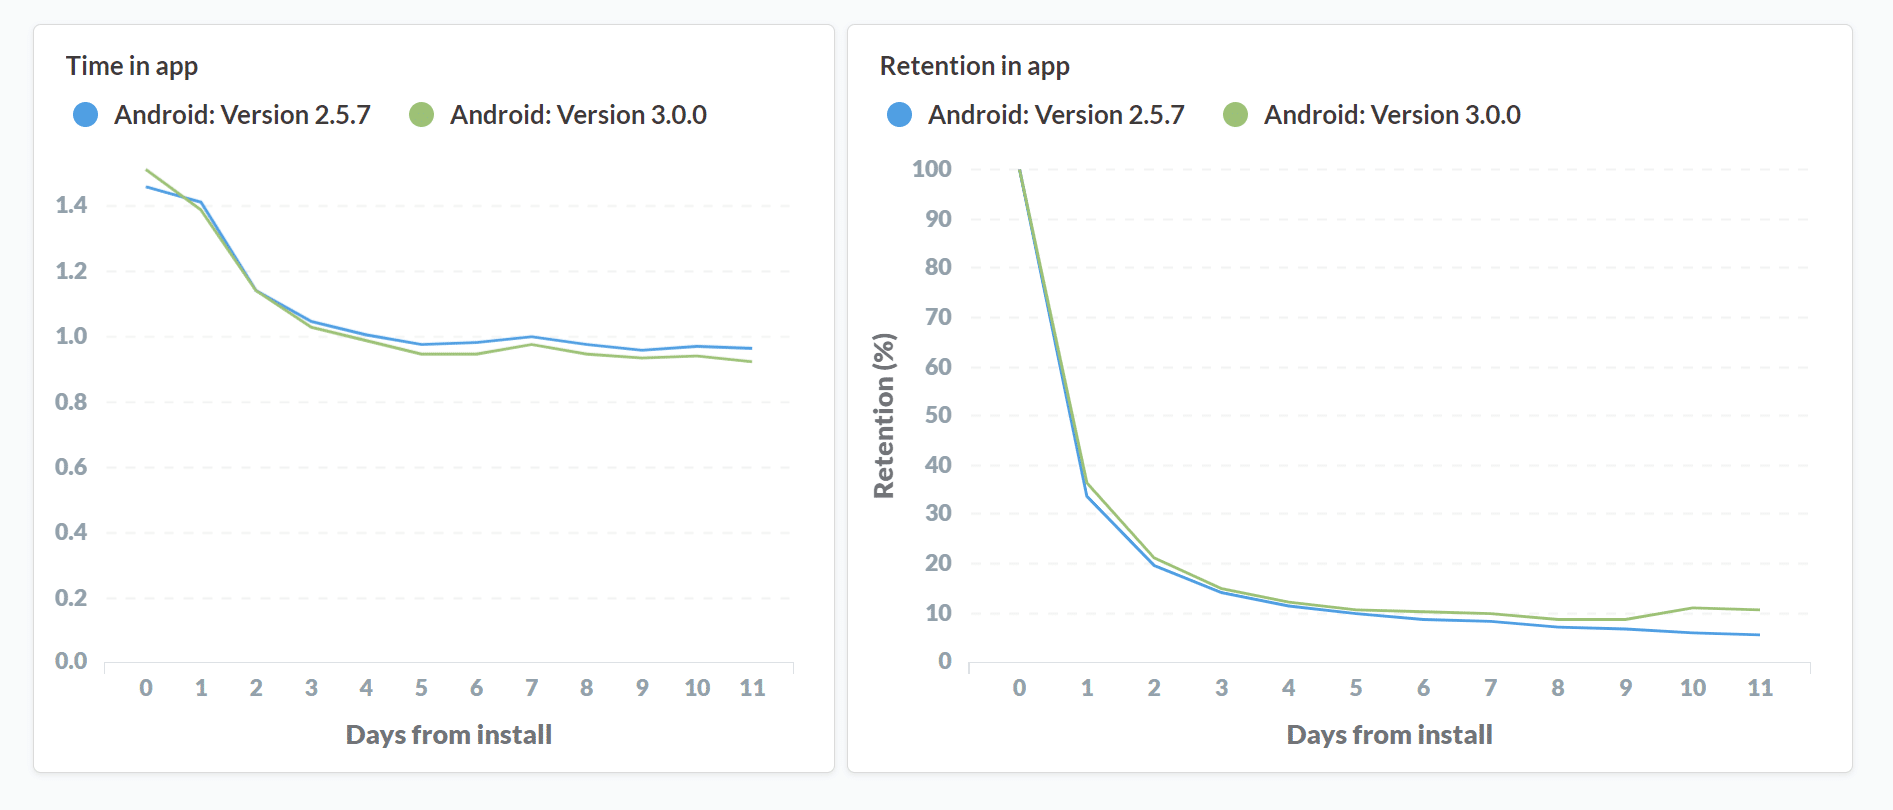
On the left: is a report showing the average daily user time in the app from the user’s day of install.
On the right: Rolling retention of users by app version.
Technical changes happen when an OS update or SDK updates happen, they may not have any changes discernable to the end-user but instead introduce new back-end technology. Anyone who’s installed an ad SDK knows they’re prone to introducing problems. We’ve seen app developers track ad-type revenue per app version to uncover quickly if the latest SDK release has broken reward videos.
Examples include ads viewed per user; ad impressions per app version; coins earned/spent per user; time spent in-app per version.
User onboarding might be considered a functional change, but in an industry where 60% of your users will never come back for a second day, it deserves its own scrutiny. A great example is a dating app, looking at sign-ups may not be a good KPI, especially if the marketing team is on a burst buy. But looking at installs vs. sign-ups on a given day may give you a good indication of your product changes are positively or negatively impacting the user’s onboarding experience.
Examples we’ve seen: rolling day-3 retention rate; tutorial completion by cohort; social shares per sign-up.

On the left: LTV of users by app version.
On the right: Daily CPM by app version.
Live Ops
A live op team’s function is similar to product’s – they’re trying to increase engagement, retention, and monetization – but they’re doing so without pushing app updates. Instead, they’re pushing live changes to the app or specific changes to a cohort of users.
AB test results are probably the most straightforward of KPIs live ops teams use. This can be an app change, a waterfall/ad monetization change, or something more sophisticated. And with most AB tests, increasing LTV is the desired outcome, but it’s not the only one. Watching user engagement, retention, and other key metrics per test variant will give you a more complete view of the long-term effects of an AB test.
See this article on examples of KPIs helpful to measure AB test outcomes.

.On the left: Average time spent in the app, since day of install per test-variant.
On the right: LTV of each AB test variant.
Cohort activations & Engagement will allow you to see how segmented audiences are performing, after all, if you’re treating audiences differently, you’ll need to track their performance separately. A great example here is how Visual Blasters is changing pay-gates for user cohorts, based on their buying behavior
CRM and push notification impact
In the ongoing quest for increasing retention, app developers are increasingly investing in CRM and anti-churn push notifications. The idea is if you can engage a user personally – or provide a loyalty reward before they churn– you can increase their engagement and potentially keep them from leaving. Much like an AB test, uncovering the true impact requires downstream measurement, beyond day-one retention.

On the left: Day 1 songs played per user for different app versions.
On the right: Number of tutorials completed per new user-install.
Takeaways:
Your KPIs will be your own, and only by experimenting and exploring on user performance will you find the ones that best measure your app and user performance. We encourage you to test and monitor a variety, one thing that’s always true for data – the more historical performance you have, the better signals you’ll receive for future predictions. One challenge we see often is when users want to start tracking the impact of an app’s change, but they only have 10 days of historical data to rely on.
At the end of the day while these examples might give an idea of where to start, don’t be surprised if your KPIs start to become increasingly esoteric. Your app, your users, and your signals are uniquely your own; For the same reason, so should your KPIs.


