Firebase AB Testing with Ad Revenue. Use LTVs to determine test winners.

Your mediator’s ad impressions and Firebase ab testing data are combined to give accurate, user-level variant LTVs.
Introduction
An increasingly popular use case for the AdLibertas data platform is using accurate user-level revenue to measure Firebase AB testing outcomes. To help demonstrate the potential, I’ve put together a primer to share how combining Firebase AB tests with ad revenue will give app developers better measure Firebase test outputs.
While Firebase is an exceptionally powerful tool, their test outputs are limited to a handful of metrics, like the count of an event fired for each cohort, which only gives you directional confidence in success.
While optimizing towards a single event might be sufficient for some subscription or commerce apps – because a subscription or purchase is the end goal – companies that rely on in-app advertising are left guessing on the outcomes.
Put in the words of Geoff Hladik: “I don’t care about an event count, I want to know how much users made.”
Because the AdLibertas platform combines Firebase outcomes with the actual ad impressions we can provide easy exploration of ongoing or completed tests, with a variety of metrics and outcomes that can help quantify the test outcome you’re looking to achieve.

For single events like an in-app purchase, a single-event optimization can be sufficient. But ad impressions are not equal, so the count of impressions is not an effective method of measurement.
Example Firebase AB Test: Will the length of a game level affect user engagement and LTV?

At some point, most app developers wonder how their app’s difficulty, length, finish-time, reward system, or any other mechanic has a downstream effect on user behavior. Will it help, hurt, or does it even matter to your app? As we’ve covered in “The correct framework for AB testing your app” the only certain way of determining the outcome is by testing.
In way of example, let’s consider an (anonymous) app. This app “Swimming Salmon” is running Firebase AB tests and an ad mediator (e.g. Admob, ironSource, Applovin MAX, or MoPub) to monetize users via advertising. The AdLibertas platform is collecting the Firebase analytics, AB tests, and user information and combining them with the ad impressions.

While this example tests level-complexity, really anything can be tested, provided the remote configuration can alter the dynamics in-app. For tips on AB testing, see our interview with Random Logic Game’s Alex McArdle “Firebase AB testing: tips from a pro.”
Watch the analysis – or step-through on your own.
To make this test possible the app developer has Firebase remote config set up to deliver differing level-lengths to the app. The AB test is set up so Firebase distributes six, equally sized cohorts, of varying game-level length to measure differing retention, engagement, and earnings of users. We’ll skip the test measurement set-up and go right to the results.
Daily Active Users (DAU) per variant
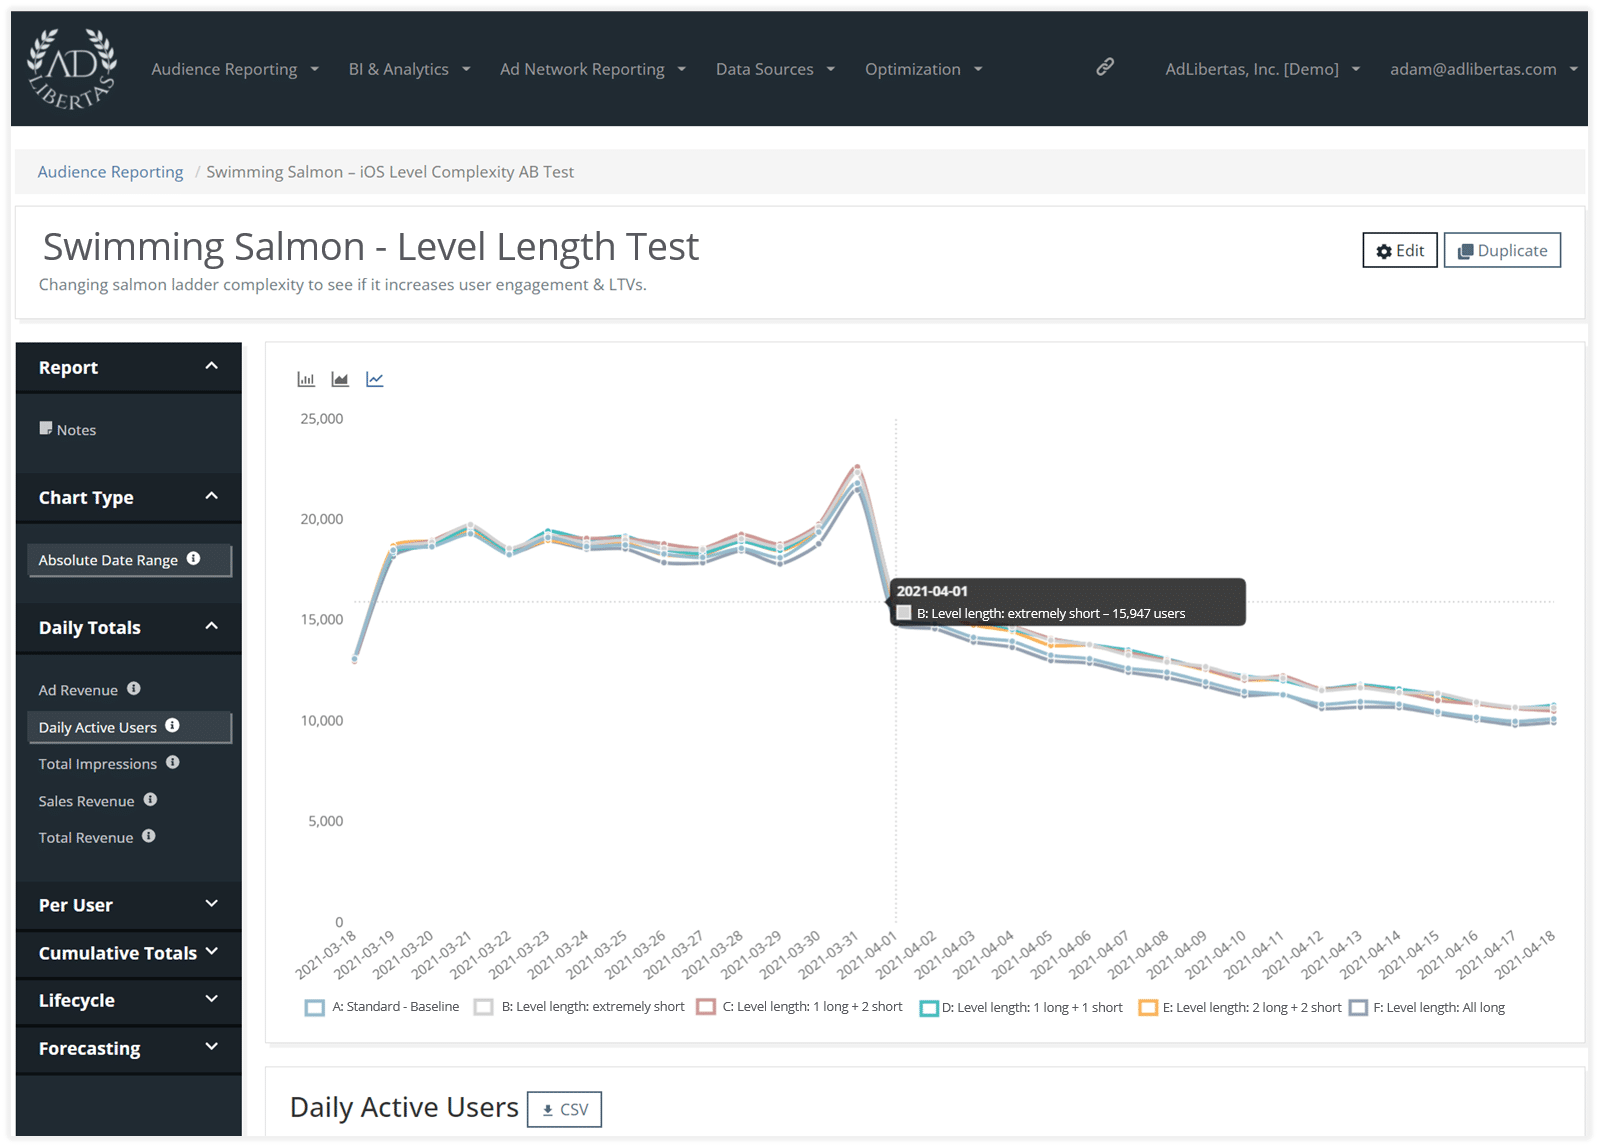 The first section of the analysis we visit is comparing each test variant’s daily active users. Right away we see a fall-off of user app engagement in the long-level variants.
Is this indication these users are churning because they aren’t getting enough satisfaction on game completion? This wouldn’t be the first time the psychology of reward showed itself as relevant for mobile apps.
Daily impressions per variant
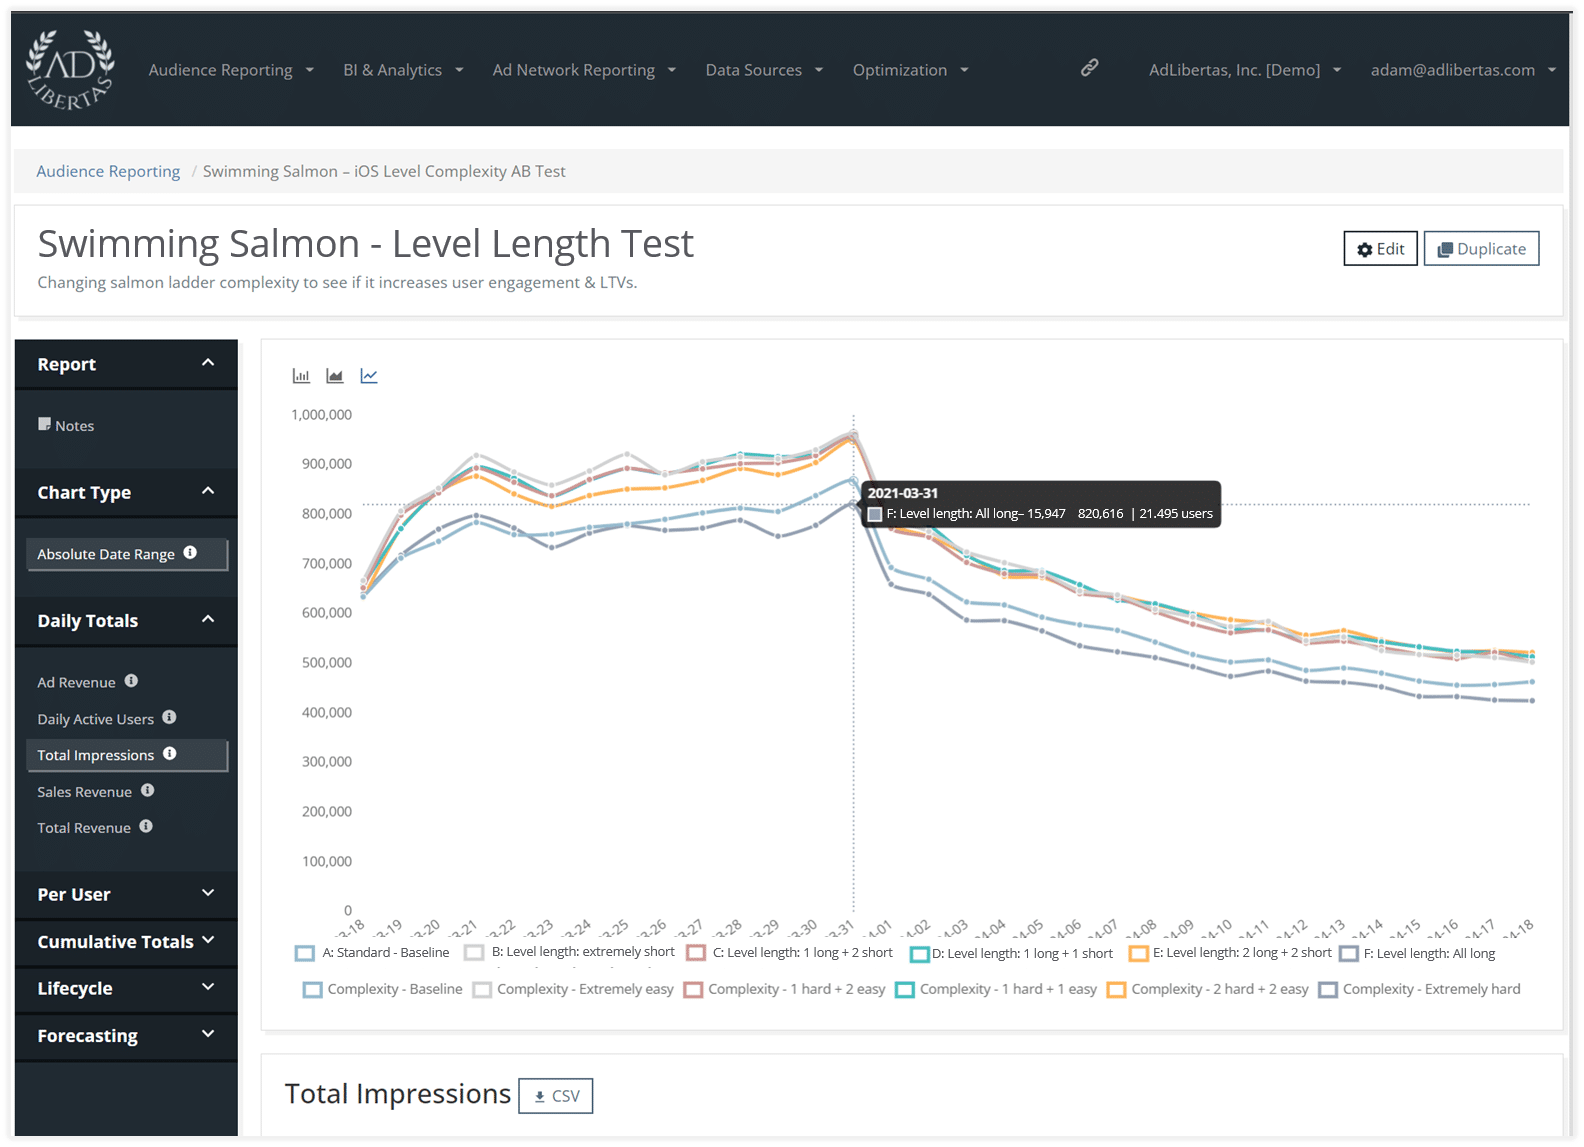
Here we see a clear gap, where long-levels are seeing fewer total impressions. They don’t come back, or they don’t engage with as many ads, presumably, because they are stuck on long-play levels, get bored, and are not coming back to the app.
Daily CPM per variant
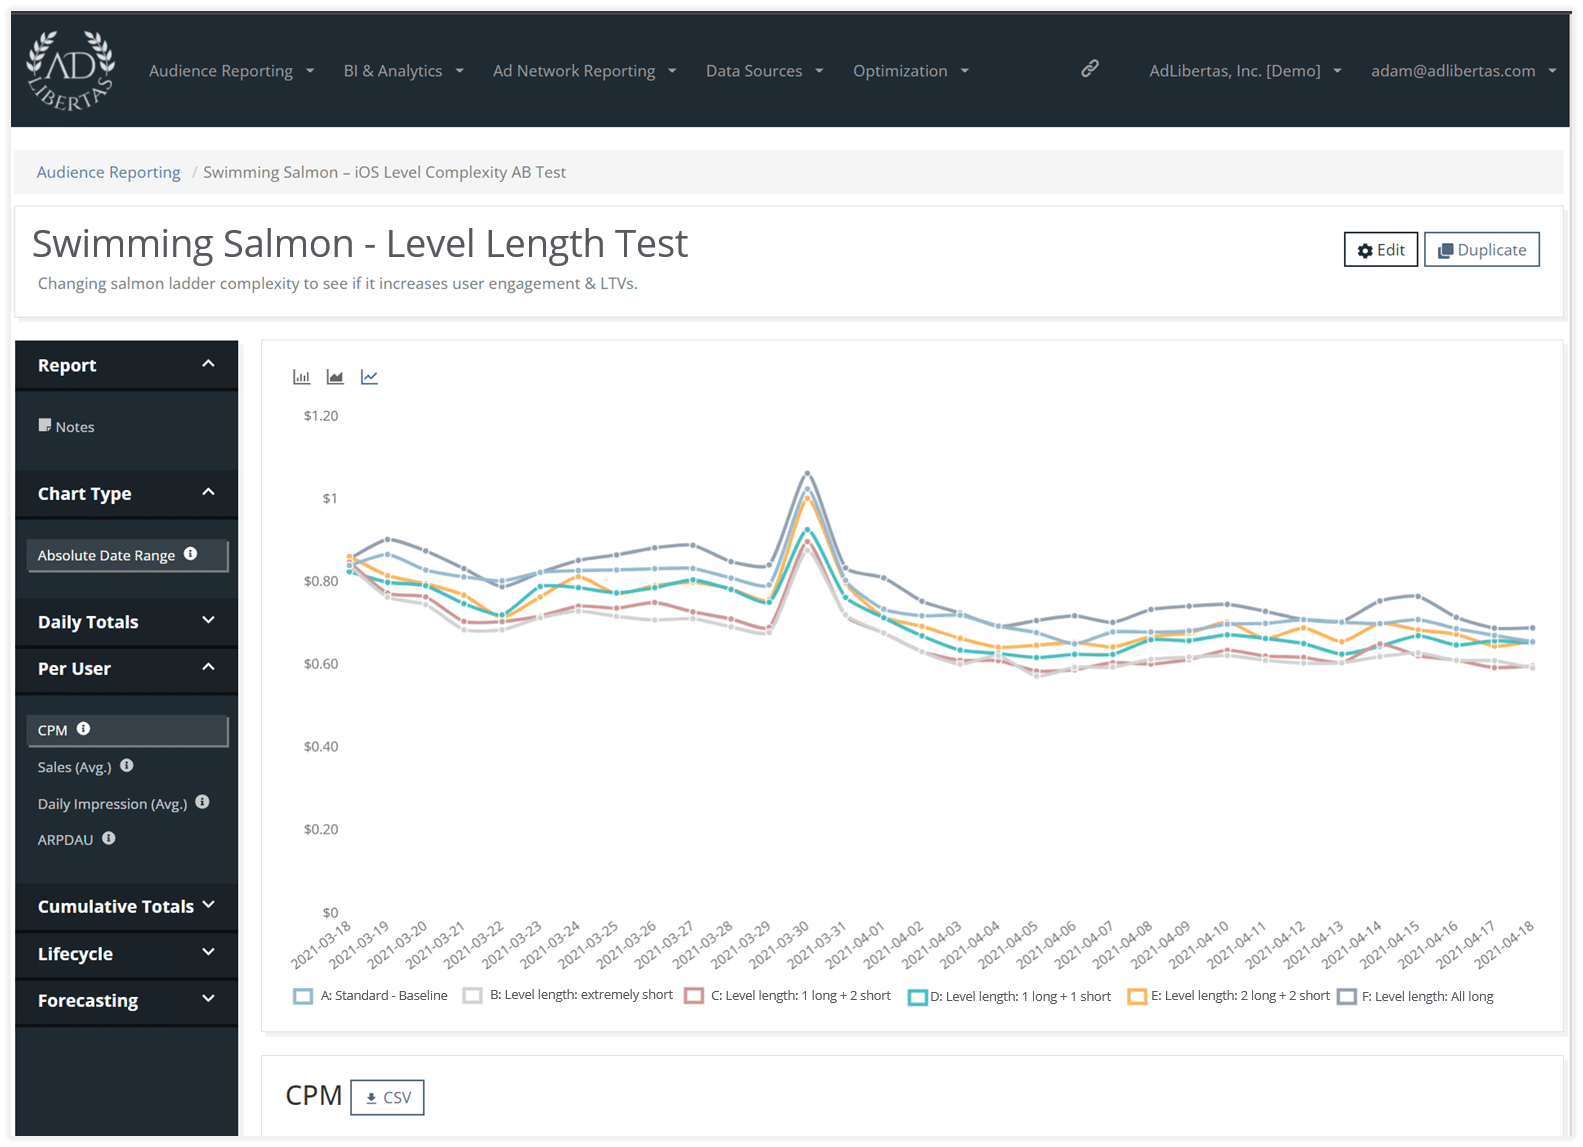
Interestingly, CPM for the longer levels is higher. Although this shouldn’t be surprising, the combination of fewer impressions per user and the fact there is more time between levels indicates advertisers will pay a higher value-per-impression shown.
Cumulative impression total per variant

This view shows the running total of impressions per variant. We see a clear drop-off on long levels, they aren’t driving as much ad engagement. The rest show a higher impression engagement over time.
Cumulative revenue per variant
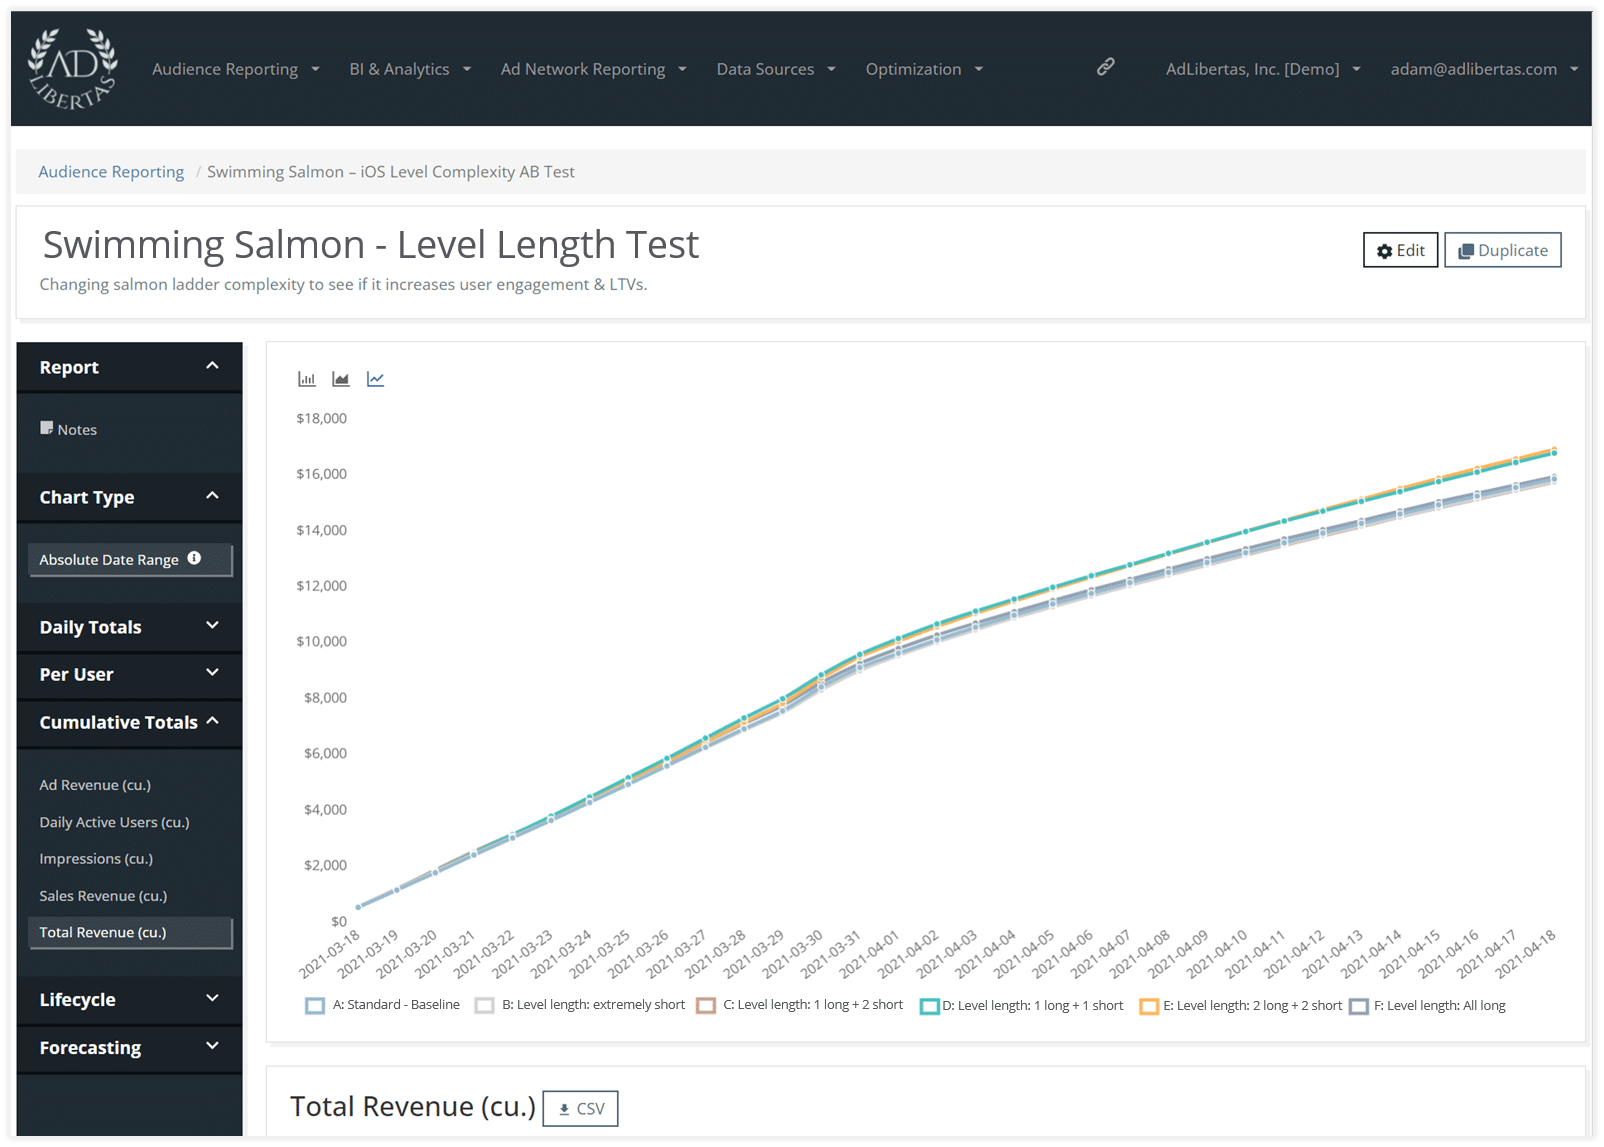
Here’s where we can start to see the value of bringing in revenue to the test results. This chart is showing the cumulative revenue earned by each variant. The yellow variant (2 long + 2 short) looks to be edging out the 1+1 in total revenue earned. The easy level (light grey) falls off, likely due to the lower CPM.
Retention per variant
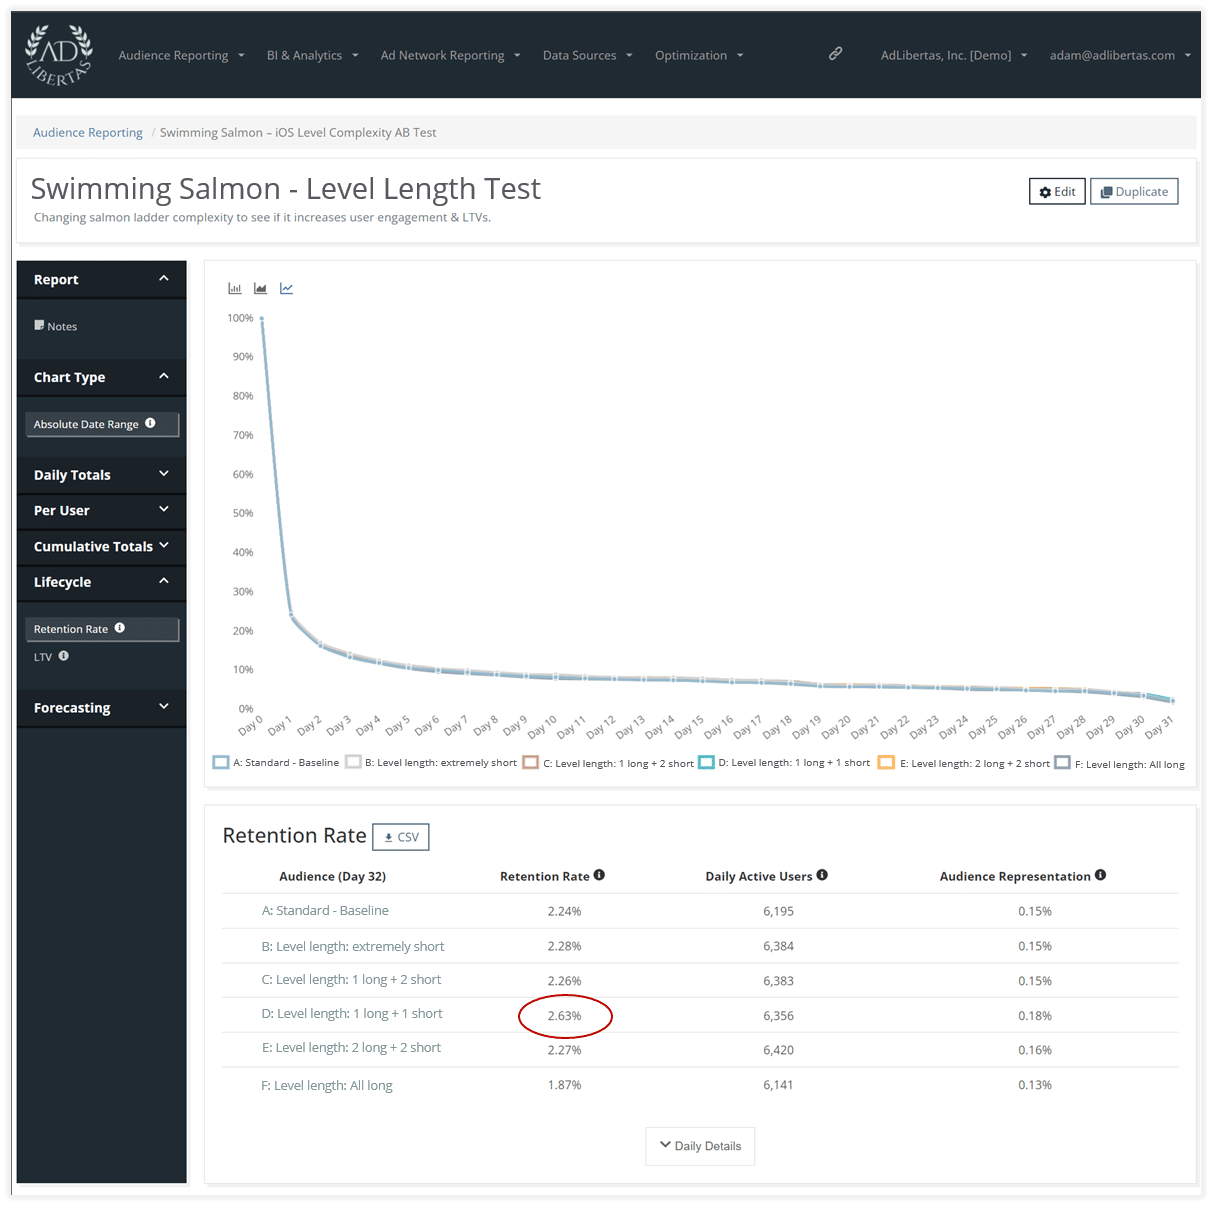
The retention curve shows a changing story. While the outcome may seem slight, the green 1+1 test is a full 0.4% higher (~15% higher) at 30 days than the yellow 2+2 test. This can matter over the entire lifetime of a user.
LTV per variant
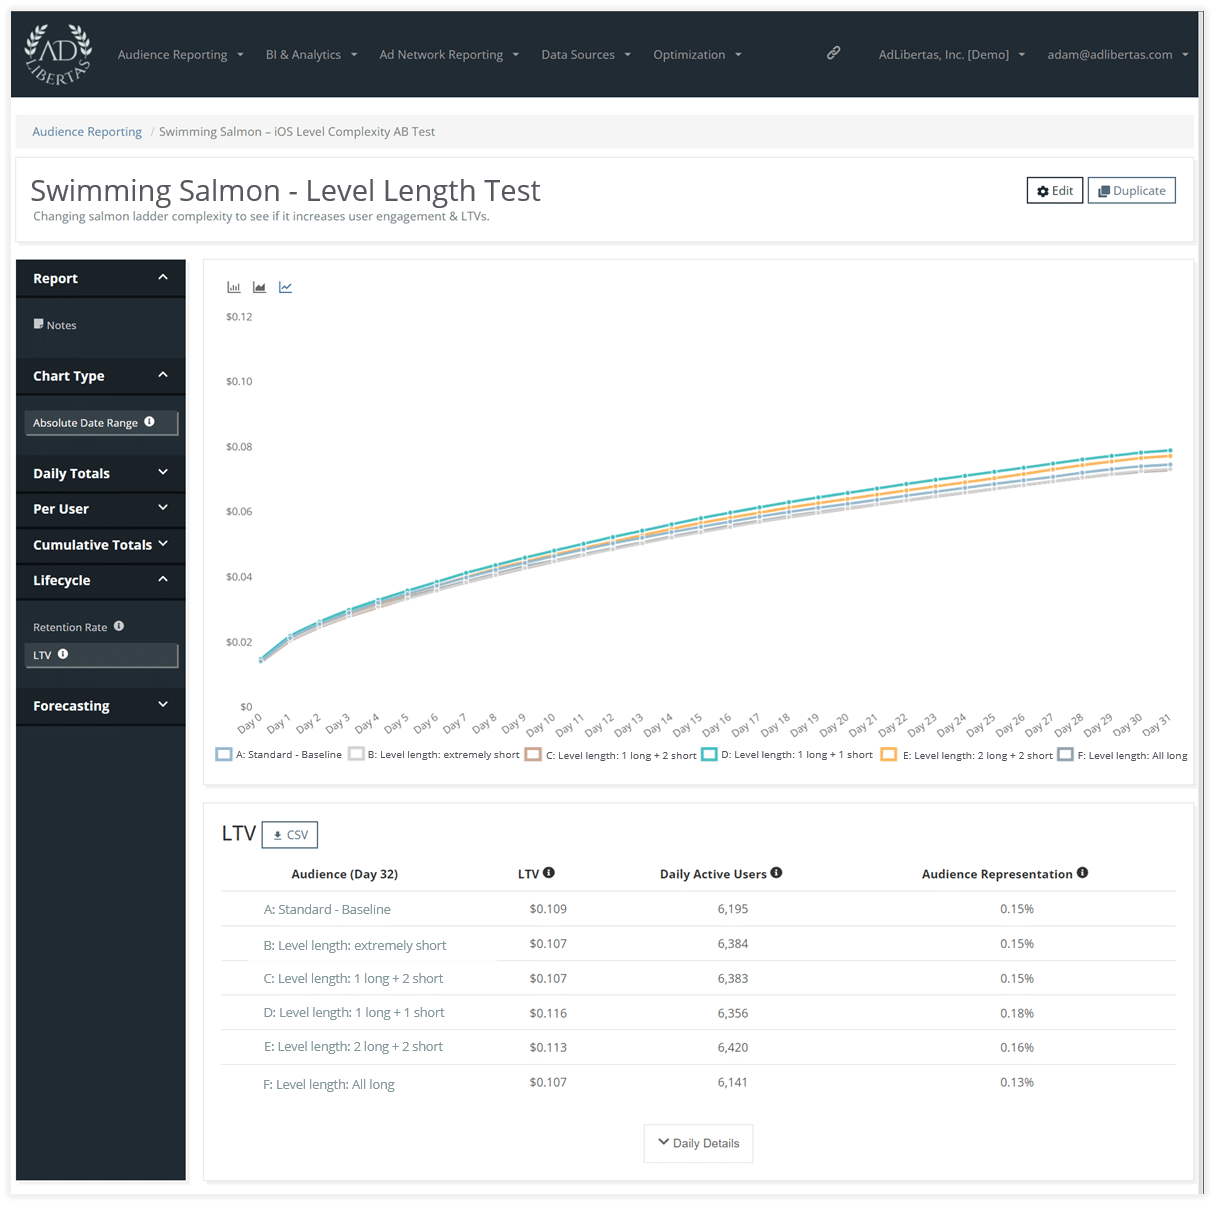
Shows an interesting outcome. The green 1+1 test is a clear winner, the combination of highest retention, median CPM, and higher-than-average impression-engagement means the winner of this test is a full 6% higher than the baseline after 30 days.
Predicted LTV (pLTV) for individual variants
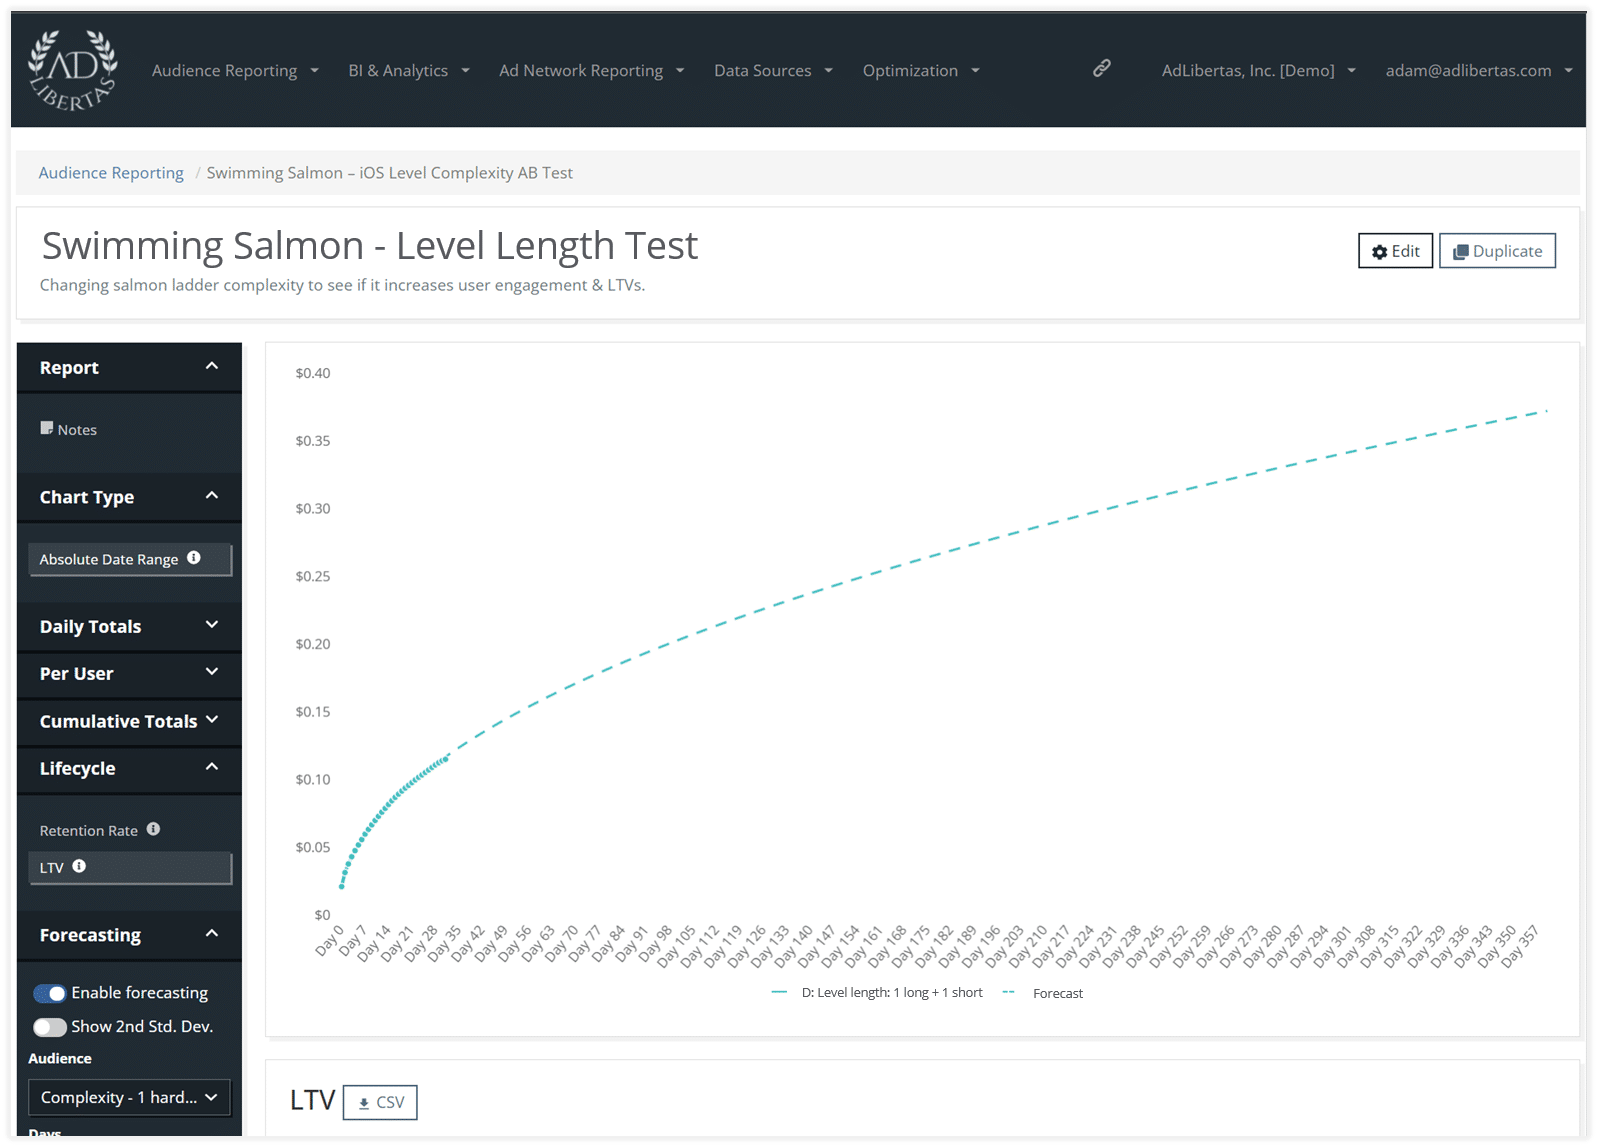
When using regression analysis to project the winner’s overall value at day 360, we see the change in pLTV rise to an 8% increase over baseline. This means rolling out this test– provided we hit statistical significance– would likely increase our overall revenue by 8%.
Conclusion:
While it may not seem like much, increasing d360 LTVs by 8% could have a dramatic influence on ROI for user campaigns. And like most AB tests, the winner represents a positive iteration in product maturity. These compound and increase over time and since this outcome simply requires configuration changes—remember there is no cost differential for implementing this change.


