Finding a pLTV model for your mobile app
3 methods for building a predictive LTV model (pLTV) for your mobile app.
Background:
There’s a litany of articles for measuring the lifetime of a user’s value (LTV), which is sometimes called CLV (customer lifetime value). LTV is an often misused term. The definition implies the total value earned over the entire lifetime of the customer. In most cases, the entire lifetime is impossible to measure, and more importantly, impractical to use. In mobile applications, the market moves quickly enough that knowing the value of a user acquired over two years ago introduces so many changing variables it, alone, doesn’t provide much insight or information to help with forward-looking marketing goals or product improvements.
Another term—rapidly gaining momentum is predicted LTV– or pLTV—which is the predicted value of a customer, usually at the end of a timeframe. At the highest level, the pLTV model uses past learnings with the most-current measurements possible to generate a predicted value of a user at the end of a timeframe. For instance, pLTV d365 is the predicted value of a user at the 1-year mark.

“The critical component, obviously, is a pLTV model that reliably highlights your most valuable users and customers very early on in their experience with your app.”
-John Koetsier
Recently Singular had an excellent article on how pLTV is the new gold standard for buying via Apple’s new iOS14 policies. But how does one calculate pLTV?
This article outlines three methods for calculating a pLTV model for your apps, (1) an easy method to get a high-level straight-forward user pLTVs; (2) a more advanced method using actual revenue and regression modeling and (3) some popular computing solutions used by the most advanced players in the space.
The easy way: Broad-Stroke Averages
At the highest level, you can simply use the average earning of a user, such as average revenue per daily active user (ARPDAU), then factor that against the average retention to estimate an average user’s pLTV.
For example, let’s say you want to estimate pLTV at d365. First, calculate a user’s ARPDAU:

Then find the average users retained at day 365:

Then the average d365 pLTV is calculated as such:

Once you have the pLTV of a user at d365 you can use this for modeling and estimating user earnings by high-level segmentations like geo or platform. We’ve seen this method used for apps just getting started for modeling out user-acquisition campaigns or comparing the results of an AB test.
The Good:
In short, it’s easy. You can probably get a directionally correct LTV for your users in 5 minutes. This can be good if you’re looking to compare two similar groups of users or just want a high-level view of customer value.
The Bad:
The accuracy can be way off. Because you’re relying on averages, this model has a propensity to break down with apps that have extremes. If you have a large amount of revenue that’s earned by a small number of users, or if you have a highly skewed retention curve you’ll likely get very poor (inaccurate) results.
A Better Way: Regression analysis on user-cohorts
The most impactful way to increase accuracy is to use actual, granular numbers, instead of relying on averages. In this approach, you calculate LTVs by using actual revenue earned for each user from their install date. This is accomplished by adding up the revenue earned by each user cohorted to the same install date.
Step 1: Compile accurate user-level retention & revenue
While this sounds straightforward don’t underestimate the difficulty of this step. To normalize the retention of a group of users, you’ll align all users with the same install date. The resulting curve will be your retention curve and will give an accurate view of the customer’s retention over time. Then you’ll compile revenue metrics per user by aggregating all revenue earned per user.
- For in-app purchases, you’ll need to track & validate purchases and subscriptions for each user against the app store or use a service like RevenueCat.
- For ad-supported apps, you’ll need impression-level earnings per user. For all other monetization, you’ll need to aggregate customer earnings against individual users.
- Revenue for each user, aggregated by their retention will give you the user-LTV.
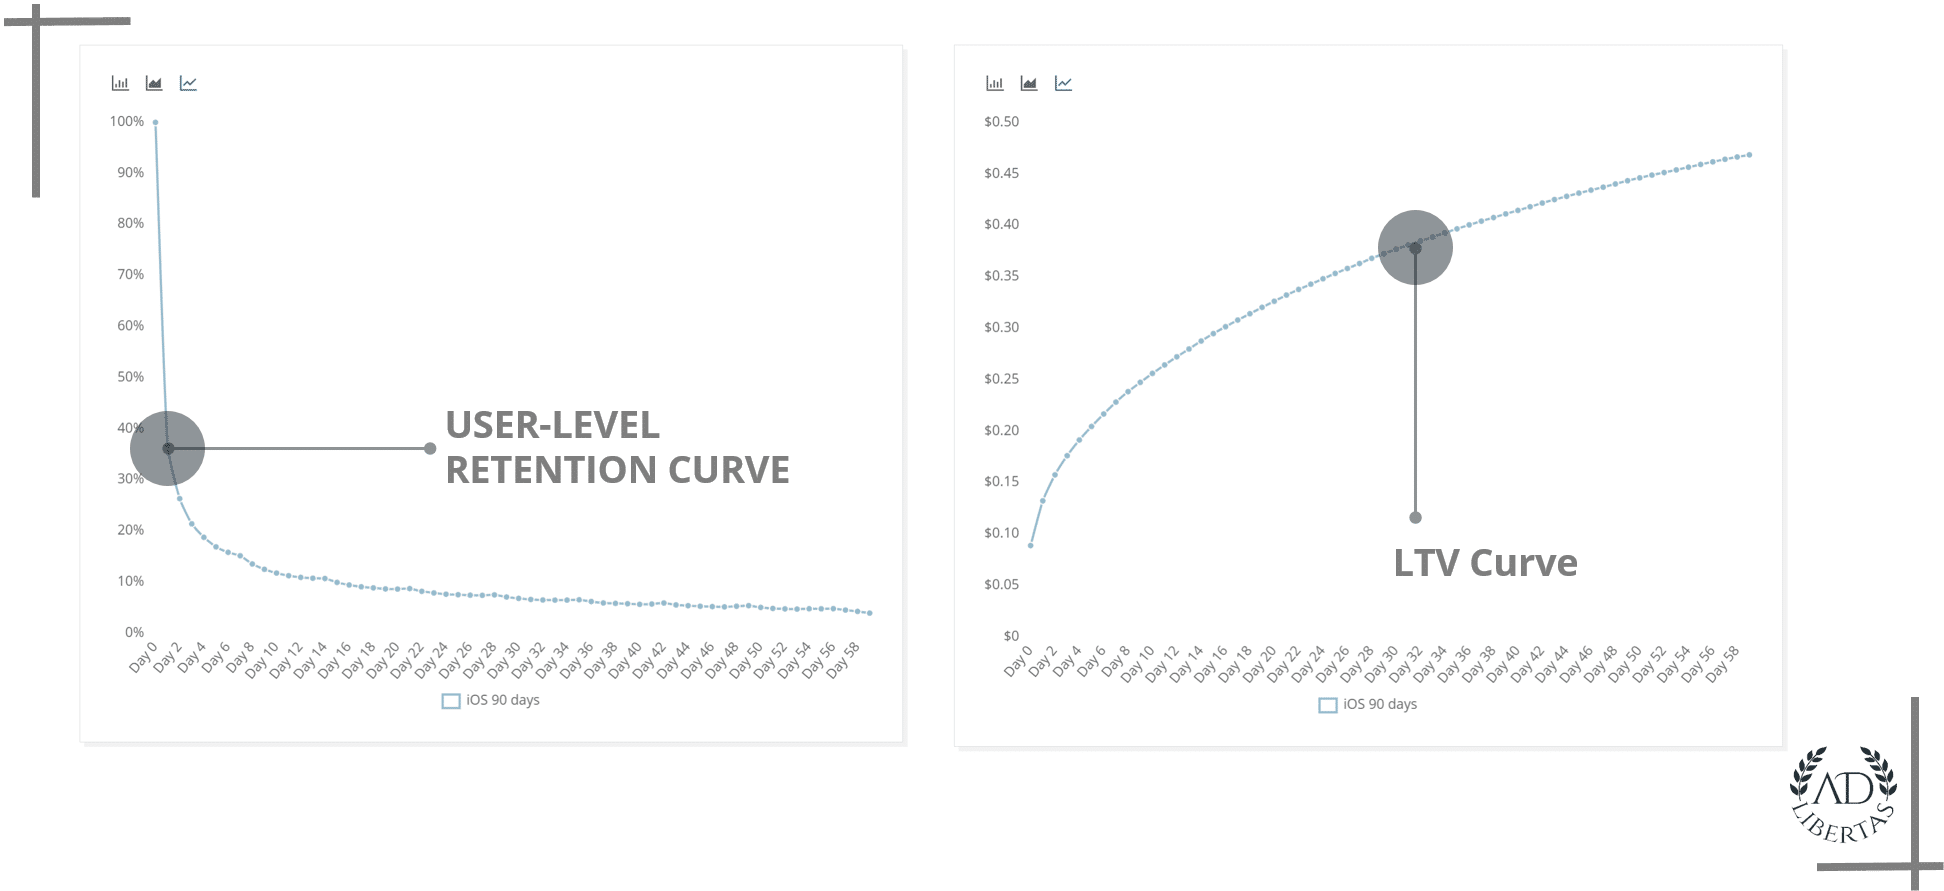
On the left a cohorted user-retention curve for 90-days of new iOS users. On the right, the LTV curve of those users over the same time period.
Step 2: Calculate a regression curve that best fits your user behavior
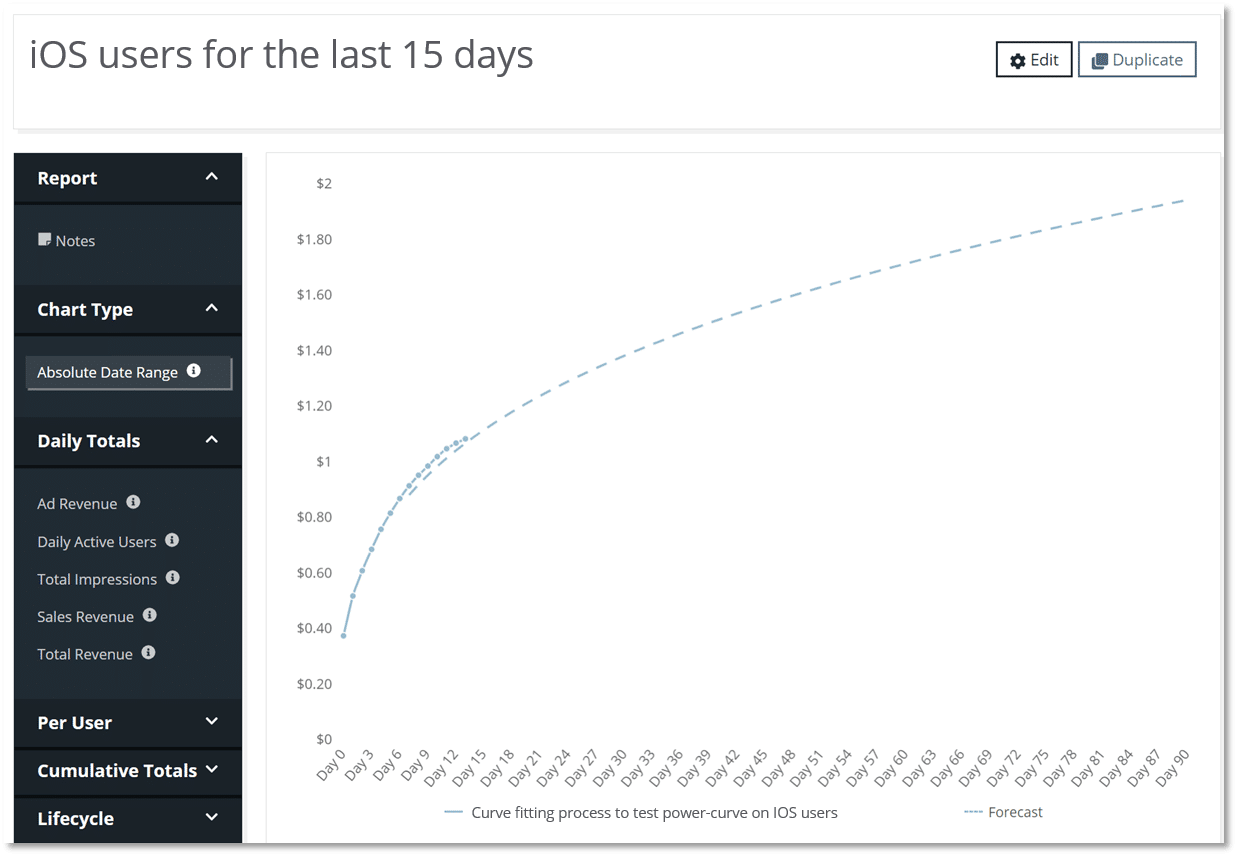
The next step is to fit a regression curve that predicts and simulates actual user behavior. This is done by taking the actual cumulative revenue, broken down by day, and calculating a curve that best describes the actual data points. This curve can then be extended out beyond the actual data points to provide an estimated value for the desired day in the future. For example, with 15 or 30 days of actual revenue performance, you can fit a curve to extrapolate the cumulative revenue for day 365.
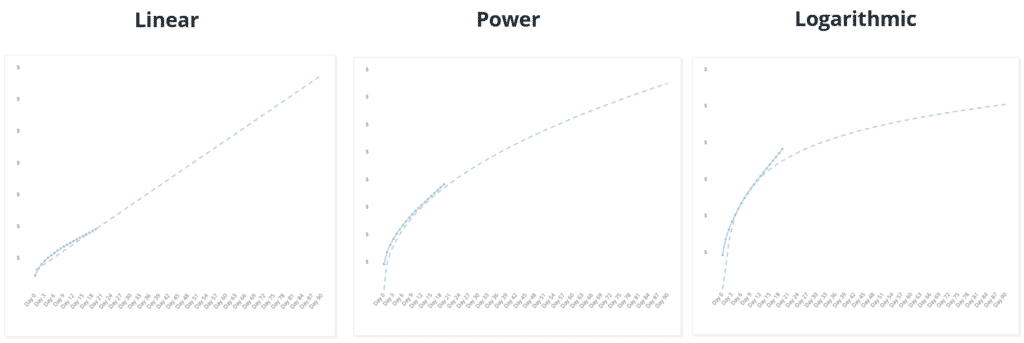
An example of 3 regression corves over the same incomplete LTV curve of users. Projections will relate on the type of app and the behavior of its users.
Step 3: Segment & project performance
Users of your app will generally have a similar user experience, and therefore the time-series regressions will likely look similar from cohort to cohort. Over time, you’ll begin to recognize how much data is necessary to predict the shape of the curve accurately and establish a minimum number of data points to know whether this cohort is behaving similarly to others. You can then establish “checkpoints” or shortcuts to speed up the data collection to confirm a cohort is on track to hit the desired pLTV target.
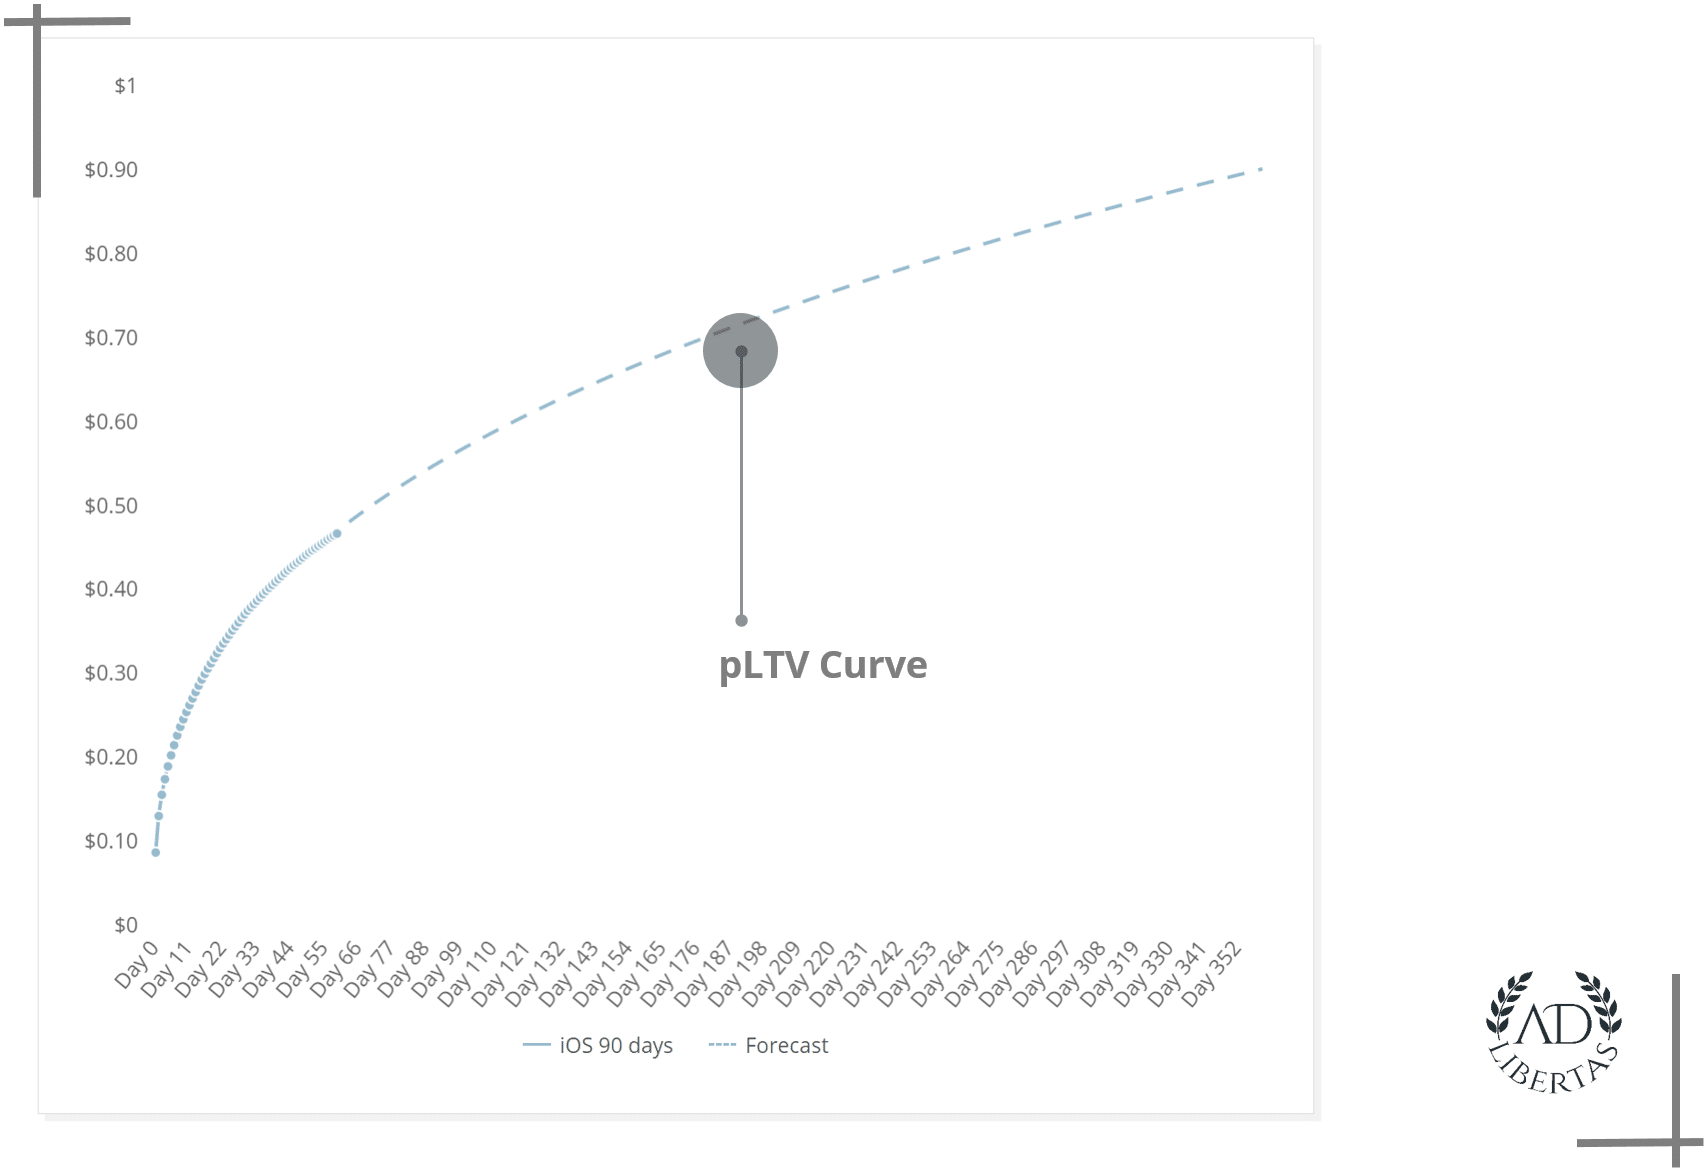
By extending the curve, you can get accurate predicted revenue for a group of users out to a year or more.
The good:
At AdLibertas, we’ve found that a collection of time-series regressions extrapolates fairly accurate predicted user values without huge investments in infrastructure, data science or computing power.
The bad:
Time-series regressions don’t inherently take into factors like seasonality or major events, which might have a major impact on the earnings of the cohort. For example, Black Friday/Cyber Monday are major drivers of both ad revenue and eCommerce, and a time-series regression of users that install in early November won’t capture that boost of earnings.
Examples:
AdLibertas pLTV Reporting
Our customers use our comprehensive data platform to aggregate user data, measure user performance and find the best regression curves for pLTV models.
Theseus Tools
Eric Seufert of Heracles: An open-source library of common marketing functions for analysis for measuring growth.
The advanced way: building your own machine-learning prediction model
Machine learning is increasingly being used to create early user-level predictions of user values. In this practice, a data scientist uses a wide array of data generated by app users: analytics, revenue earnings, historical trends, and seasonality considerations– to create a (self-improving) algorithm that will predict a user’s value based on early actions in the app. A simple example of output would be a custom-built ML model finding that a small subset of users who install in California on the newest OS version and watch 3 reward videos on day one are worth $3.20 on d365, whereas a user who only watches 2 reward videos on day-one is worth $2.40.
The approach can vary from leveraging and customizing best-of-breed existing libraries to a fully custom model built from scratch. In most cases, a pre-built model is optimized for a specific output and the parameters will be customized for the app’s purposes. In all cases the more investment, the more accurate the model becomes. This, of course, comes at a cost. Or in the words of one data scientist: “a pre-built model provides an auto-pilot but you still need someone to fly the plane.”
The good:
A properly implemented ML model can give you unparalleled accuracy at the user level. For the app developers who are able to take immediate action on this information, it can give significant leg-up on increasing user engagement, retention, campaign optimization, and other optimization techniques.
The bad:
ML models require an incredible amount of investment, data, and cost. In almost all cases, there is a trade-off between accuracy and complexity, and as the accuracy levels of the complexity will continue to increase:
- Investments to get started: Some best-of-breed tools still requires (1) data engineering efforts to collect, clean, and align your data, (2) training and tuning variables to customize the model for your unique needs. In most cases, this investment will likely require a data scientist or a dedicated resource to implement and customize correctly for your purposes.
- You’ll need massive amounts of clean data: Much like the downside of regression modeling, an ML prediction with no data is worthless. A custom ML model needs a vast amount of data to create reliable, accurate outcomes. And much like regression modeling, more data is better than a more complex (or better) predictive model.
- Increasing complexity = increasing cost: the compute-portion of the predictive analysis shouldn’t be overlooked. Mobile apps can generate a massive amount of data, and when the lifetime of a user can be a few cents, running computation against terabytes of data over years can add up. In short, getting an extra $.02 from a user doesn’t make sense if the compute resources cost more than the analysis.
Examples:
AdLibertas ml-predictions
We work with our customers to develop self-tuning customized ml-models that use historical performance to make fast, accurate predictions.
H2O
An open-source platform with support for commonly used statistical and ML algorithms.
Facebook's Prophet
an open-source ML library built for forecasting time-series data
Amazon Quicksight
ML-powered business intelligence reporting built with easy connectivity to AWS-powered services and data-storage.
Pecan.ai
Predictive analytics platform that offers out-of-box AI to help build custom ML models
Algolift
Uses predictive algorithmic ML models to predict LTVs.
Without a doubt, pLTV will continue to gain popularity as the most important metric for determining growth, predicting profitability, and making growth decisions. The app developer looking to utilize the metric will have to balance complexity with accuracy and effort to determine the best method for their efforts.
Did we miss anything? Let us know your thoughts on pLTV methodology or if you’re interested in learning more about the AdLibertas platform that could streamline your path to using pLTVs, reach out to the team for a conversation!
Interested in learning which model is right for your business?
