Connecting Applovin Max with Firebase
I was on the phone this morning with a fast-growing game studio and we were commiserating on the challenge—and opportunities—of integrating Applovin MAX ad revenue with Google’s Firebase platform. Now that Applovin Max is poised to become the world’s largest mobile app mediator and Google Firebase is the most ubiquitous mobile app analytics platform, there are many app developers than can empathize with the points covered in our conversation.
Why connect Applovin with Firebase?
Applovin’s MAX has effective ad-revenue reporting that can show you how much a user is worth. Firebase is an effective analytics product that can tell you what a user is doing. But without combining these datasets, you’ll have no idea of the worth of user behavior.
Any app developer using Firebase can tell you the biggest shortcoming is not having holistic revenue included in the tool – by default Firebase only imports Admob ad earnings. This means any information in Firebase – AB testing, reporting, LTV has a flawed and often very misleading revenue outcome. Only by connecting the actual user-level ad revenue, reported by Applovin’s via very handy API with Firebase user data will you unlock amazingly useful levels of user measurement and behavioral insights.
I’ve taken the liberty of outlining some of our favorite examples of what mobile app developers are doing with these combined datasets.
Better Firebase AB testing:
The most immediately clear-cut use-cases of combined data is being able to leverage the powerful Firebase AB testing and analyzing LTV, ad earnings, and other customer KPIs as an outcome of the tests.
Live-Ops:
The next step beyond AB testing is the concept of changing app behavior for specific users. That is using Firebase remote configuration to drive dynamic app experiences. Geoff Hladik started changing the app’s behavior based on the outputs of his AB tests. As a summary, he found that gating a feature for a core set of users allowed him to increase user engagement and increase LTVs.
Day-1 user value predictions:
You don’t need sophisticated machine learning or a team of data scientists to predict the value of users on their first day. You simply need a combined set of user actions and their respective value and it becomes straightforward to predict user values based on their actions within the app.
Increasing UA performance signals – and reducing fraud
Most app developers are familiar with the concept of modeling earned value of users from an acquisition source. Campaign LTV & ROAS modeling allows you to prioritize the scale of high-performing campaigns. The next level of complexity beyond ROAS modeling is the concept of using user actions and engagement to identify valuable users earlier – and perhaps more importantly identify troublesome sources early. Bot fraud is an unfortunate problem that many app developers have faced. Recently I heard a story of an app developer finding a new install source that offered cheap installs, high day 1 interaction, but upon analysis, not a single user stayed more than a day. As fraud gets more sophisticated, the burden of finding, and taking action on these bad apples falls to the developer.
Better monitoring
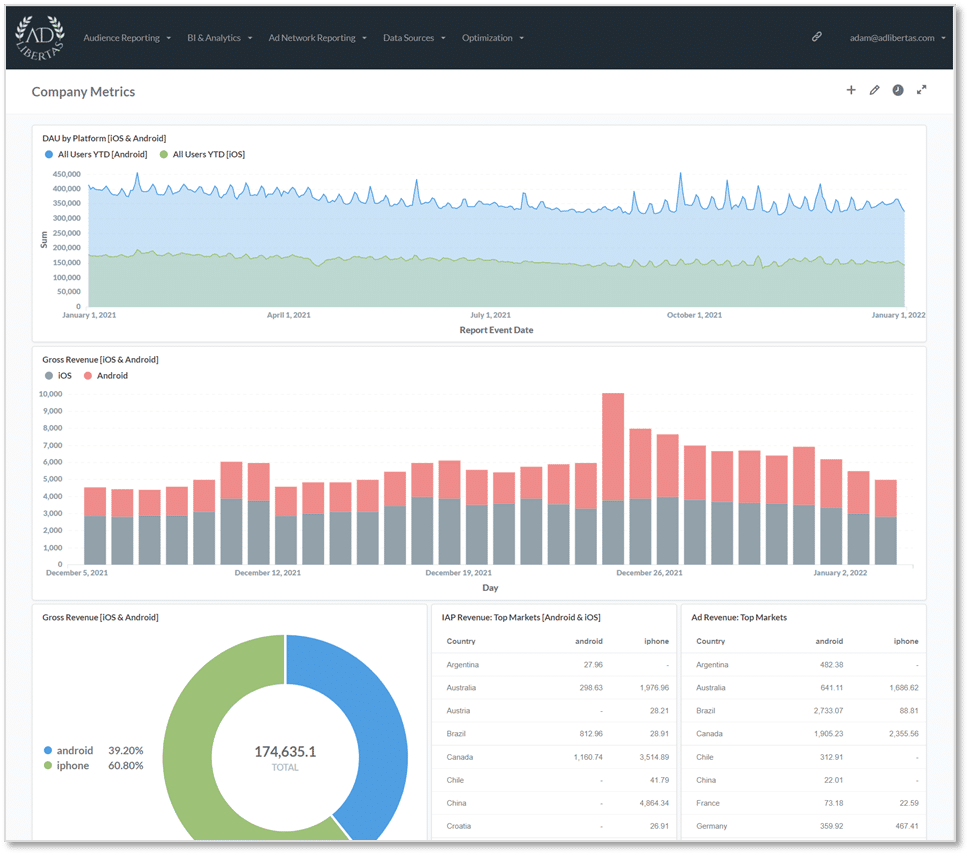
I’m continually amazed by the level of complexity app developers need to juggle. App updates, SDK versions, crashes, conflicts, and user activity. Our customers regularly create incredibly detailed and massive custom dashboards to monitor ongoing app performance. We’ve found every app business has different health metrics, and virtually all have different ways of tracking ongoing success or looking for failures. Here are some examples we’ve seen:
Tracking revenue by app release version – for apps that are fast-moving and constantly releasing new versions, the horror of a “broken release” is real. For most, it’s a relatively common occurrence, and finding the problem as soon as possible is imperative. For this reason, most of our customers track ad revenue by type by app version to mitigate any broken SDKs or other ad revenue problems.
Tracking LTV by app version – With hyper-casual apps the smallest app change can spell vastly different long-term results. For this reason, we see large hyper-casual apps track LTVs by app version, knowing that a slight change – albeit game logic, install flow, or any other variable—can matter.
Tracking sign-ups to installs – a large dating app I spoke with has an interesting way of tracking the ongoing effectiveness of growth over changing UA campaign volume and app releases. In this example, a customer of a dating app is virtually worthless if they don’t sign up, but with (expensive) daily install fluctuations it can be confusing to watch installs as a separate metric. Instead, this company watches the ratio of sign-ups to installs as a barometer of growth.
How do you combine these datasets?
Now that we’ve talked through the benefits, you’re probably wondering how it’s done. There are a few examples:
1. Combining datasets with your own data platform
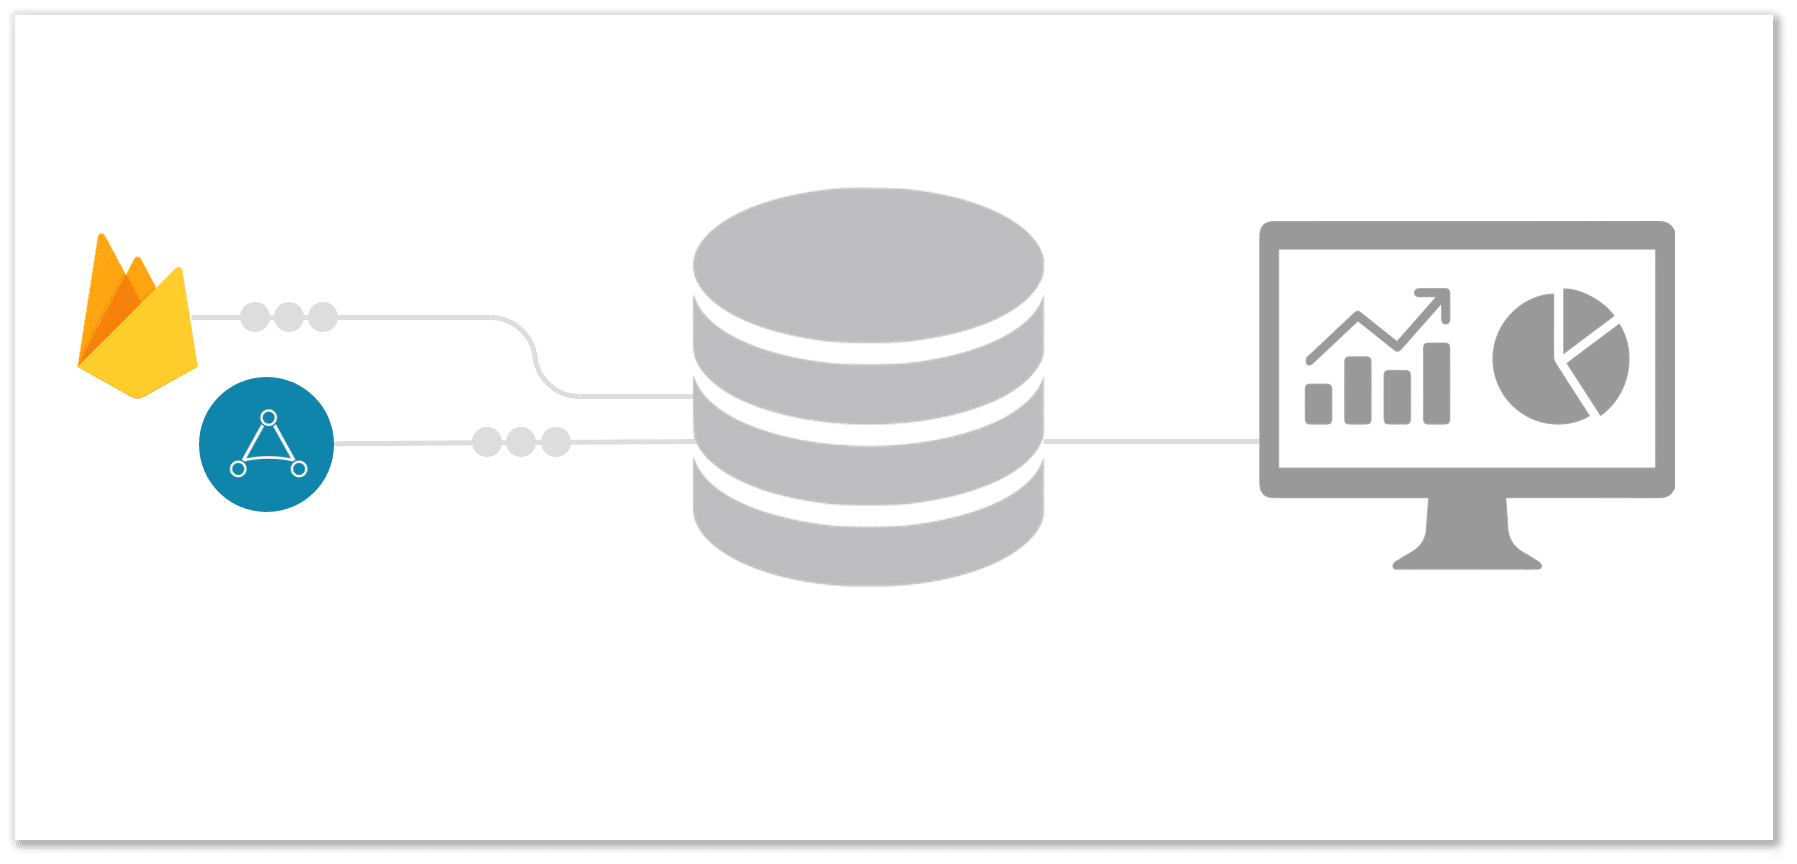
Popular with the DIY crew. This generally means creating a data pipeline to combine the data sources, choosing a storage technology (google cloud, snowflake, redshift), and analytics (Looker, Tableau, etc). The good news is if you’re willing to staff and support the endeavor you’ll have a highly sophisticated capable data platform to help you move forward. There are plenty of tools and options for your project but we’ve seen the sicker-shock of building and maintaining this product can be unattractive in sunk-cost and time to market. For many, this can mean six months to a year of R&D and monthly server costs of $30K or more, depending on the size of your datasets.
2. Revenue callbacks sent to Firebase
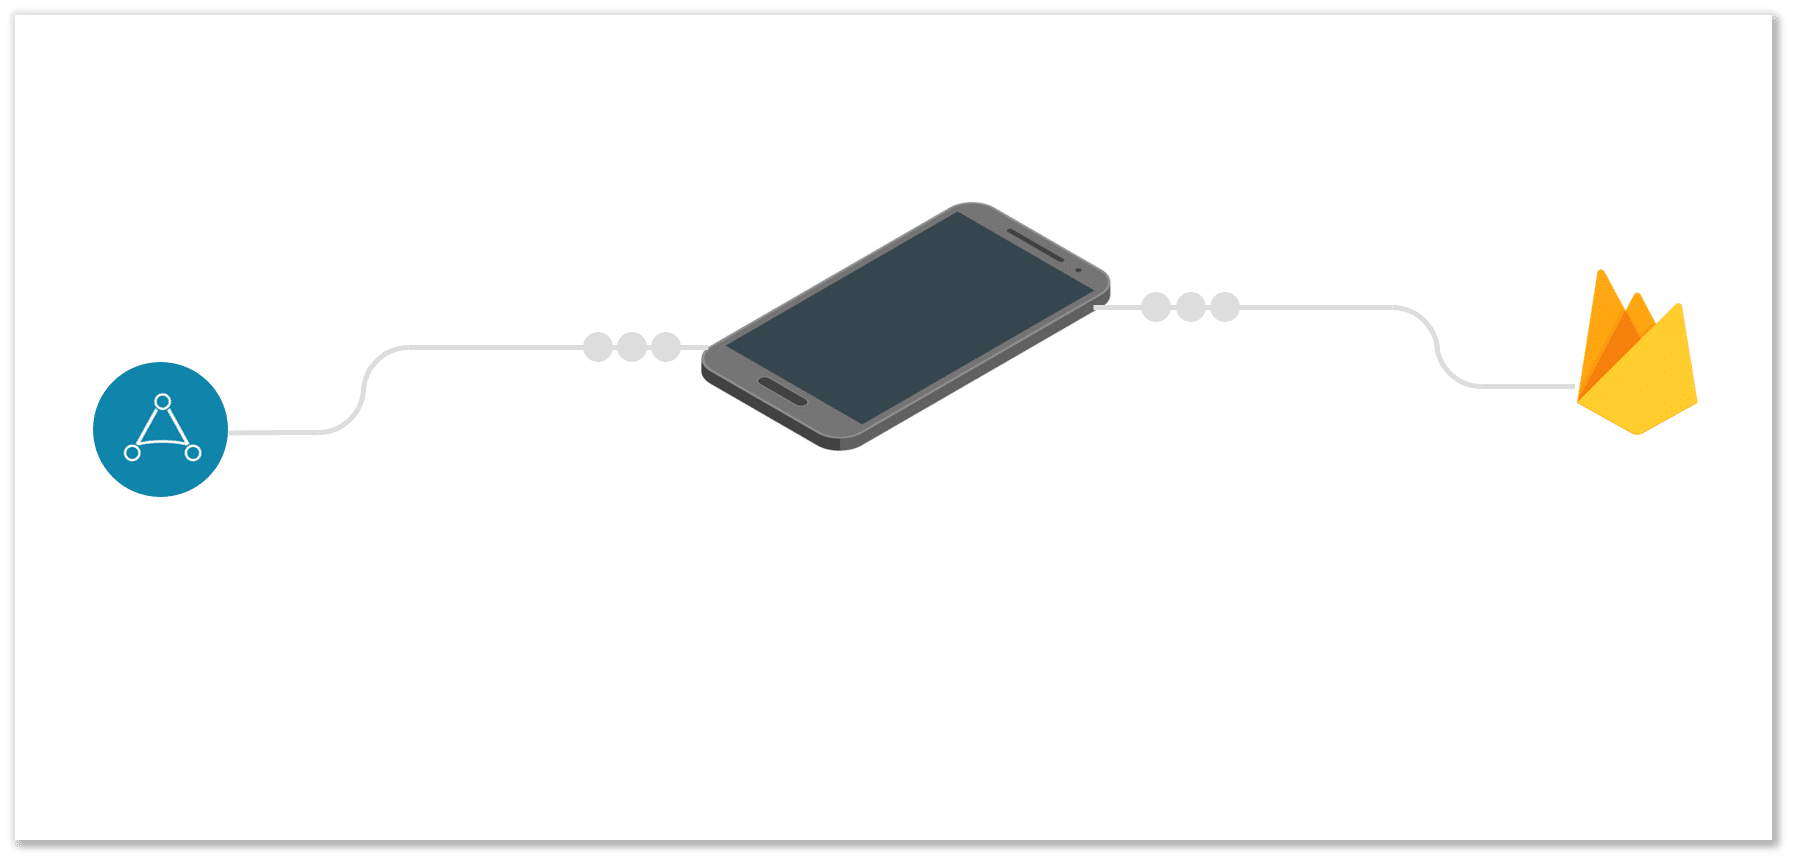
A slightly different variant on building a platform from the ground up is simplifying by centralizing all data into a single location. Max allows app developers to send ad revenue callbacks– with the value of each impression—to the device. Then you simply need to relay this event to Firebase to consolidate actual ad revenue in a single place. The downside – as anyone familiar with Firebase data structures can attest – working with this data, even in a consolidated format, can be very difficult. Even once you’ve settled on a schema and data structure, you’ll still need to construct the custom SQL to pull and transform the data into the correct format.
3. Using a pre-built tool.
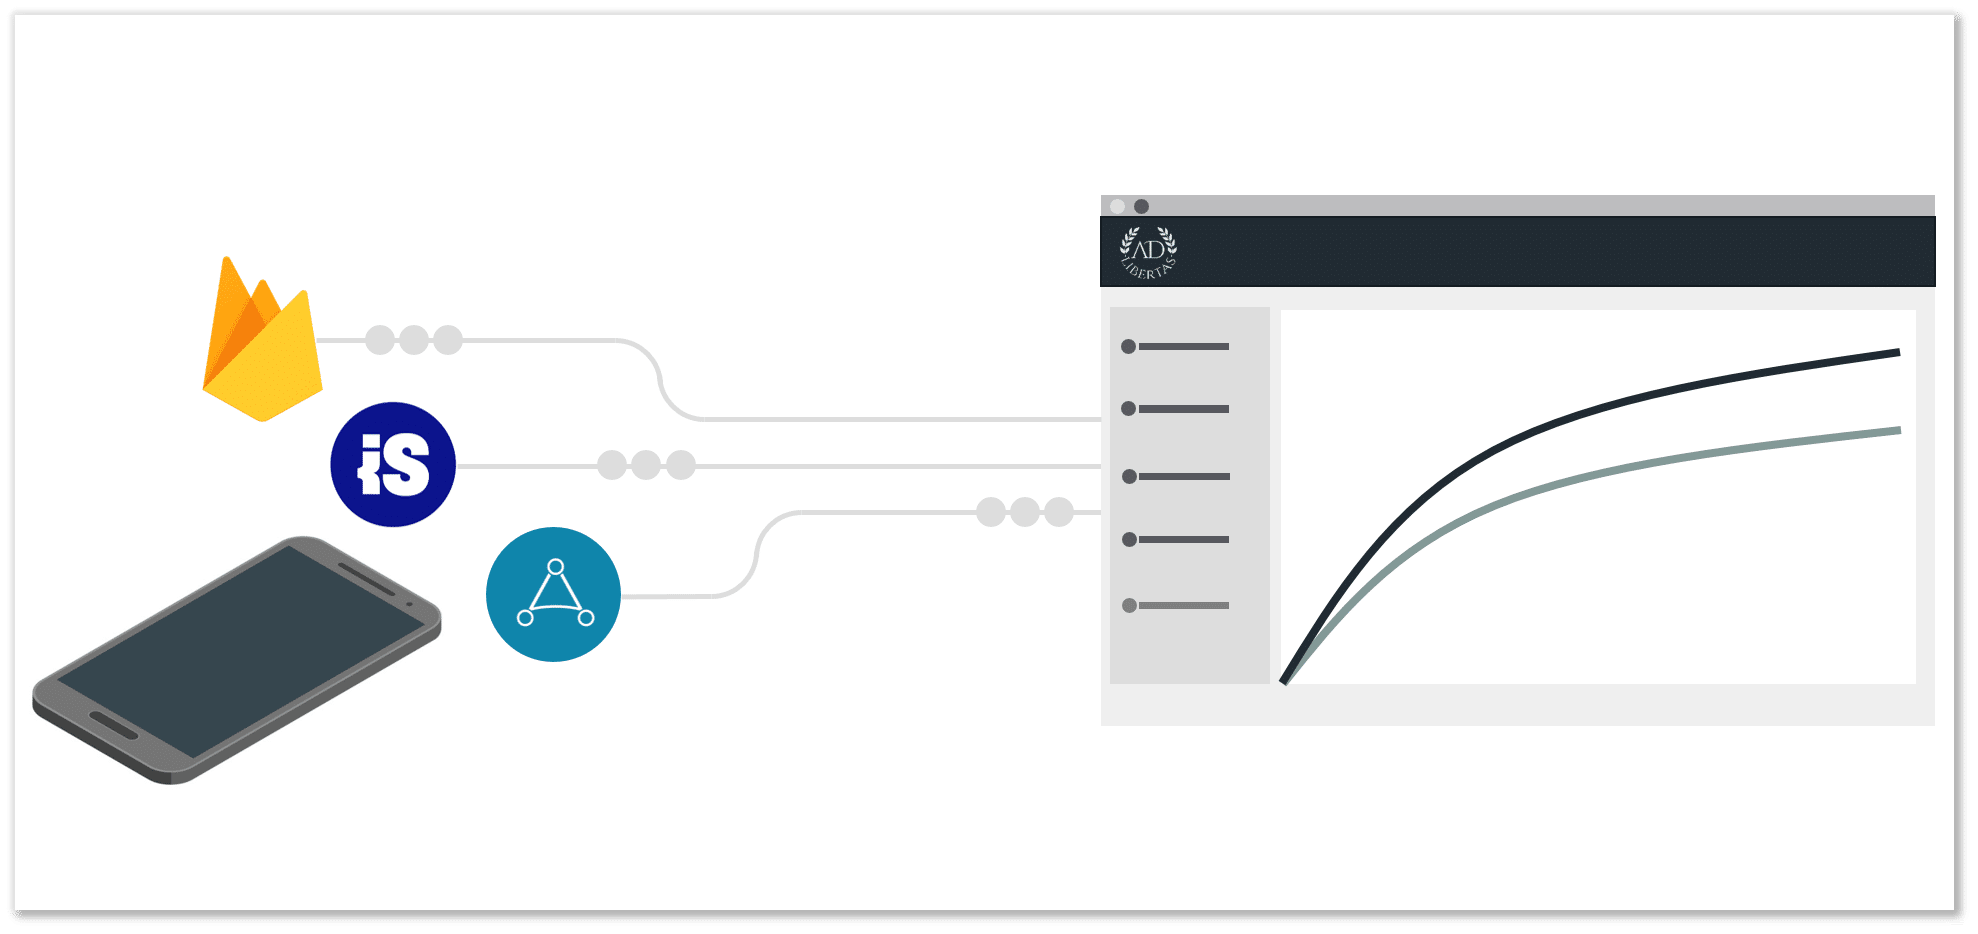
We at AdLibertas have built a platform that will skip any need for custom integrations, data engineering, or SQL writing. Our customers quickly connect with just API keys and get up and running, often getting useful insights same-day. Plus, because we’ve built the architecture to run on pooled resources, we can run more cost-effectively than most app developers will pay running their own architecture.
Closing
Effective growth requires using data to develop and prove your strategy. Only by combining your user-level Applovin Max ad impressions with Firebase user-event data will give you the data you need to define, test, and refine holistic user behavior.


