Why should you link ironSource and Firebase?

Mobile app developers using ironSource and Firebase can greatly benefit from combining the data from both platforms to help them with better measurement and success prediction.
Introduction:
I was on the phone today with an ironSource app developer and he asked an interesting question: why should I combine my ironSource and Firebase data? The answer is, in short, linking ad-revenue with analytics allows you to use user-revenue to guide product development and growth marketing goals.
But hearing him ask the question made me realize there isn’t a great resource for the benefits and actionable information in linking these two important sources of mobile app data and since we do this all day, every day, I hoped to summarize some of our findings. This article will assume you have basic understanding of the purpose of ironSource and Firebase and instead focus outlining the common cases our acting once getting access to this combined data source.
Centralized data is increasingly becoming a critical component of a mobile app developer’s success – but equally important to its important is understanding it’s complexity. When someone says “centralized data” they mean all data-sources are combined to be queryable and available for the organization. Think of it as business intelligence across all information generated by an app’s services and vendors.

Above is a common app’s back-end data architecture: many disparate sources with little cohesion or abilitity to normalize. This makes getting an accurate view of user-behavoir difficult.
The problem today is an app generally uses many different services – analytics to track a user’s behavior, mediation to serve advertising impressions, in-app purchases for subscriptions and a mobile marketing platform to track user-acquisition activity. But these services– at best— generate different types of data that need to be combined and – at worst – live solely in those company dashboard and are all accessed separately.
Partly driven by platform restrictions, partly to facilitate increased sophistication, app developers have undertaken the efforts of building data warehouses to combine these sources to provide ease of access, and answer the questions contained herein.
Use Case 1: Data-driven app design
As buzzwordy as this title sounds, there’s a very simple mantra to the approach. Let data help you decide the app’s design. Now this is easier said than done. Where do you start? Simply put: let data validate your assumptions. Combining your source of revenue (ironSource) and analytics (Firebase) allows you to put the most important metrics behind user action: earnings and retention.
First, find important events.
Do you have actions in your app that you think are important indicators of future behavior? ironSource impressions will tell you the money made by an individual user, Firebase will help map that user’s journey. Combine them and you can measure the lifetime earnings of users who act in a certain way. We had a customer who said “I really think users who complete a tutorial are likely to stay in the app longer.” Turns out he was right.
Customer Use Cases:
Measuring how ad-tracking opt-ins effect LTVs.
PixelTrend learns users who allow ad-tracking are worth 5X users who opt out of tracking.
Measuring how an onboarding tutorial effects user-retention
Cult-classic animation app FlipaClip learns that users who finish a tutorial are worth 2X users who don’t.
AB testing to drive user behavior
Iteration is key to success. Firebase AB testing is increasing in popularity. The simplicity of the tool makes running AB tests easy. Unfortunately, the results of the AB tests are based on a single event. This might work if you have a single event in your app: “buy everything now” But most apps have subscriptions—spanning multiple events– or ad impressions which span hundreds or thousands of events. These events can be spread out over years, looking at a single event won’t tell the whole story. To measure the winner you need to focus on the most important metric. Earnings.
Customer Use Cases:
Testing game-complexity's effect on user retention
Random Logic Games uses Firebase AB testing and AdLibertas Audience Reporting to test game mechanics and increases user LTVs 10% in a single AB test.
Optimizing ad-tracking opt-in doubles revenue.
Sebastian Hobarth, CTO of Pixel Trend, has started optimizing prompts to encourage users to allow tracking. It helped. A lot.
Case 2: Measuring Marketing Performance
At its most basic goal marketing is simple: spend $1, earn over $1. Repeat. For anyone in mobile apps, this is almost insultingly simple. Mobile marketing requires a sophistication of analysis, targeting, and measurement:
Measurement: Use metrics that matter
ironSource eCPMs or daily earnings might be a good start on measuring app performance but to measure the success of your campaigns sophisticated app developers are using average revenue per daily active user (ARPDAU), lifetime values of users (LTVs) – and while ironSource does a good job of measuring these alone, you’ll need to join this information with campaigns if you want to track campaign success or measure the impact of conversion values.
Background articles
Conversion Values
Conversion events (or values) are early indicators of a customer’s value, often used to judge campaign success.

Lifetime Value (LTV)
The upside and down of using LTVs as a success metric for you apps

ARPDAU
What it is, how to calculate it, and how it helps your app monetization strategy
Targeting: Find important users
What makes a valuable user? Increasingly app developers are looking at early behavior to identify valuable users early. This can help drive campaign success measurement quickly, helping you adjust to changing or favorable market conditions. As an example we have a customer who wanted to measure the number of puzzles completed on day 1, to see if that helped indicate the value of a user.
Tracking: Measure eventual success (pLTVs):
Once you’ve got the right measurement and targeting, tracking success is next. This involves early decisions an predictions of users – most notably the predicted value of users by cohort, which could be campaign, install day, or other grouped metric. Random Logic Games has done a great job of explaining how ironSource and Firebase data can be combined to give fast and easy pLTVs by user, audience or campaign.
Customer Use Cases:
Predicting LTV early and accurately
Random Logic Games uses forecasting to predict user-LTV early in their lifecycle.
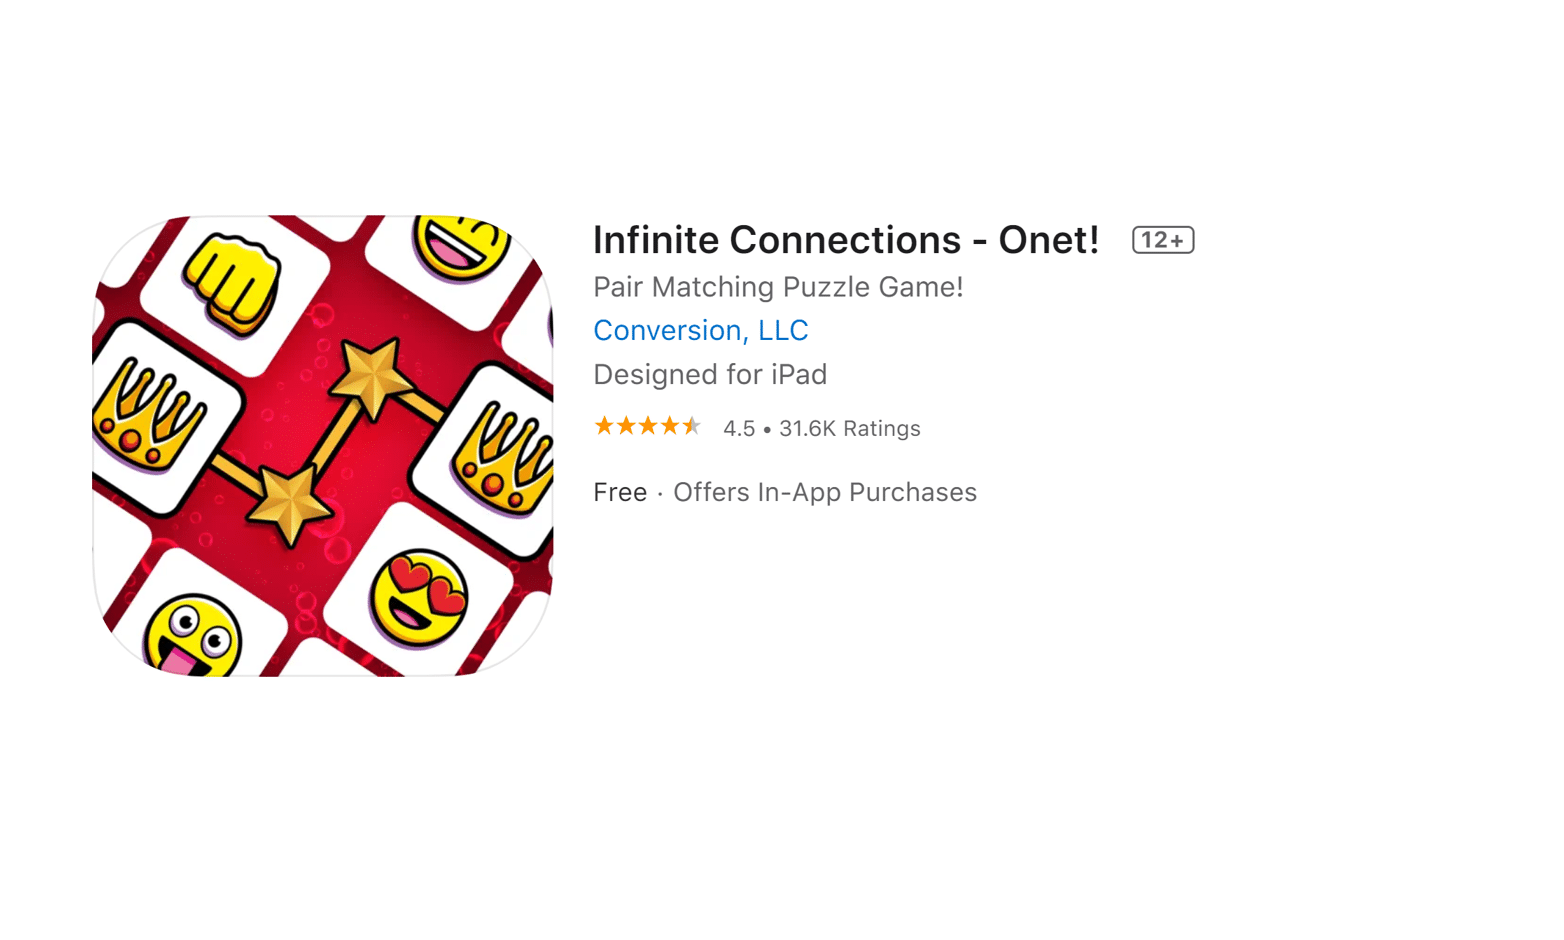
Using first-day events to predict user LTV
Big Duck games measures user-LTV by the number of puzzles they’ve completed on their first day of downloading.
Getting started: How-to unify ironSource and Firebase
If you want to download, transform and unify and manage these data-set on your own, we’ve compiled some advice on building your mobile data architecture. Highly recommend you give it a read as we’ve learned some important – and expensive lessons.
If you’re more interested in getting started quickly, without a high technical investment, we recommend you give Audience Reporting a try. We’ve built out the infrastructure for app developers to combine all data sources – without SDKs – to give them fast and easy access to their consolidated datasets. Firebase and ironSource can be added with just API keys (documentation). To learn more, give us a shout or watch an introduction on how it works.
Want to get started right away? Sign up today!


