Guest Post: How an AB test led to beginning a live ops strategy
Foreword:
Geoff Hladik manages monetization and growth for the incredibly popular app Flipaclip. Content developed on the app has generated three billion social media views last year alone.
A longtime AdLibertas customer Geoff regularly participates in our early product planning and early releases. His feedback and approach regularly help refine our product vision – and I’ve regularly found myself explaining his methodology of using our platform to guide other customers. So I’ve asked him to share his story on how we has created dynamic app experiences on his company’s incredibly popular animation app FlipaClip.
In his post Geoff walks you through his methodology for identifying, measuring, testing, and implementing dynamic product changes that result in increased user engagement, retention and user-LTVs.
-Adam Landis, AdLibertas
Guest Post: Geoff Hladik, Head of Growth at FlipaClip
An example of rotoscoping done with the Flipaclip app.
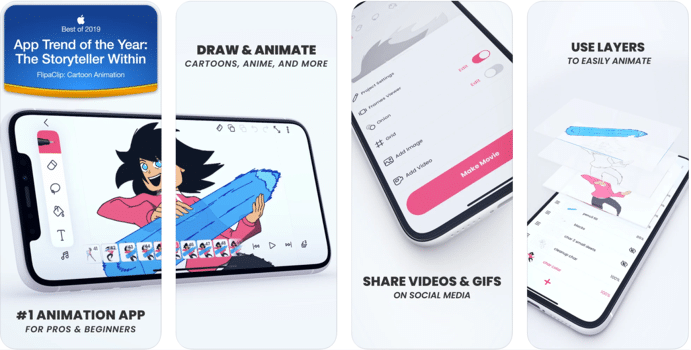
The FlipaClip app is a powerful engine for animating and rotoscoping (animating over video). Our community of creators is large enough to the point whereby small changes can really have a big impact. Budding animators, hobbyists, and professionals of all ages create works of art that can take upwards of 100 hours to complete. As a result, we obsess about providing the best possible experience for our creators and the community.
Our growth engine consists of our creators sharing content to social platforms – our content’s generated three billion views over the course of the last year – inspiring new, would-be potential animators to download the app. Thus, the combination of our long, heavily engaged sessions and social prominence mean that user experience matters a lot. Any change to the experience, particularly related to ads and IAP strategy, requires buy-in from our team after a rigorous review of the data balanced with the expected outcome on the community.
Monetizing a tight-knit and talented community with long, engaging sessions is a complex task. As a result, ads have always been somewhat of a crutch to help bring the app to the next level. For this reason, maximizing standard metrics such as ARPDAU, LTV, and retention is simply not enough. We need to ensure that our ad strategy takes into account associated performance for key KPIs across the board. This can only be achieved by working with user-level data spanning both performance and analytics data.
Disruption Helps Conversion Rates
Animation is a very creative, yet iterative process that can lead to a tunnel vision of sorts that is difficult to break once you’re in the “zone”. As a result, interstitials are a very intrusive experience for our creators and it can be likened to waking someone up while they’re in deep sleep or reading a book. A 30-second performance gaming interstitial really jams up the creative process, especially if accidental clicks out of the app happen. Either way, it’s a problematic experience that serves as a means to an end.
The catch-22 we’ve found is that interstitials drive IAP conversions. Testing different ad delivery frequencies, caps, placements, and settings yielded the same result; interstitials are necessary for us to ensure a healthy IAP ecosystem (an industry rarity). Which raised a big question, how do we improve user experience without sacrificing conversion rates for IAP and revenue from ads?
Years of experience working in the gaming industry led us to believe there was an opportunity to redefine how we manage IAP feature access and monetization through rewarded video.
Identifying Opportunities for Improvement
The first step was to review each IAP product and evaluate whether or not it was technically possible to open up the feature via rewarded video. Then, analyze the performance metrics associated with these products (events) and their associated user funnels. During our analysis, it became increasingly clear there were a few paid features that showed substantial interest from our creators (millions of feature click counts) but minimal purchases (very low conversion rates).
Some of these features allowed free, partial access with restrictions and yielded very powerful results for engagement, retention, and content creation. One, in particular, was our import video feature. We allowed creators to import videos but limited them to 6-seconds of video.
Now, 6 seconds may sound like a short duration, but keep in mind that 6 seconds could include anywhere from 12 to 180 frames, requiring quite a bit of work to animate. Nevertheless, we began seeing a lot of high-quality FlipaClip content on TikTok and Instagram for what’s known as rotoscoping, or trace-over-video. That begged the question, do people want to import longer videos? Are we hindering user experience by preventing full access to this feature?
Our objective was clear; can we improve user experience, retention, and ad revenue without taking a hit on overall LTV’s by losing the IAP revenue by making import video freemium? So, we put together a test that offered creators the ability to unlock the paid feature with a reward video.
Our Approach to Testing and Measurement
We’ve found in order to effectively measure, understand, and change monetization, engagement, custom logic, or features, you really need three things; accurate user-level data, remote configuration, and an A/B testing framework.
As mentioned above, revenue and churn alone are not our defining factors for the outcome of any test. They are, however, the most critical to track out the gate and play a decisive role at the end of testing. Our projected results for providing access to a desirable feature previously hidden behind a paywall (import video) in exchange for rewarded video were the following KPI’s:
| – Engagement: An increase of feature use as well as key downstream funnel KPIs. |
| – Retention: Improved retention for the cohort of participating creators. |
| – Revenue: Expected loss of IAP revenue but significant ad revenue gain for the creators who would have never purchased the import video feature nor engaged with the feature due to the 6-second limitation. |
Once the results of our hypothesis started showing up, we generally look at user data in two different ways; absolute and relative reports. An absolute report charts user behavior over a specific time period, whereas a relative report maps cohorted users from their install date.
We’ve found relative reporting a very powerful way of analyzing user behavior and the performance of key KPIs. Baseline metrics and data outputs for an A/B test result are not accurate portrayals of a user’s experience. By reviewing the lineage of our creator’s daily behavior from install, we’re able to refine their experience in more granular detail. This allows us to improve both user experience and revenues, simultaneously.
Along with the standard ARPDAU, retention, LTV, and revenue reports, we select a handful of key events associated with the event or action being tested that we want to monitor. From there, we begin to further break down the relative report by our key demographic profiles to include demographics and device type.
Testing and Analysis of the Results
Our test opened up a premium feature, previously partially hidden behind a paywall (creators were limited to a maximum of 6-second video imports or purchase the IAP for full-length functionality), allowing unlimited length video imports and use in exchange for viewing rewarded videos.
The results of the test largely confirmed our initial hypothesis, with some fascinating caveats, and shed light on potential significant opportunities from a product and product marketing perspective.
Creators were split into two cohorts:
- Paywall Users: (Blue): Creators limited to 6-second video imports, or pay for the feature.
- Reward Video Users (Grey): Creators able to access the feature after watching a reward video
Retention Rate
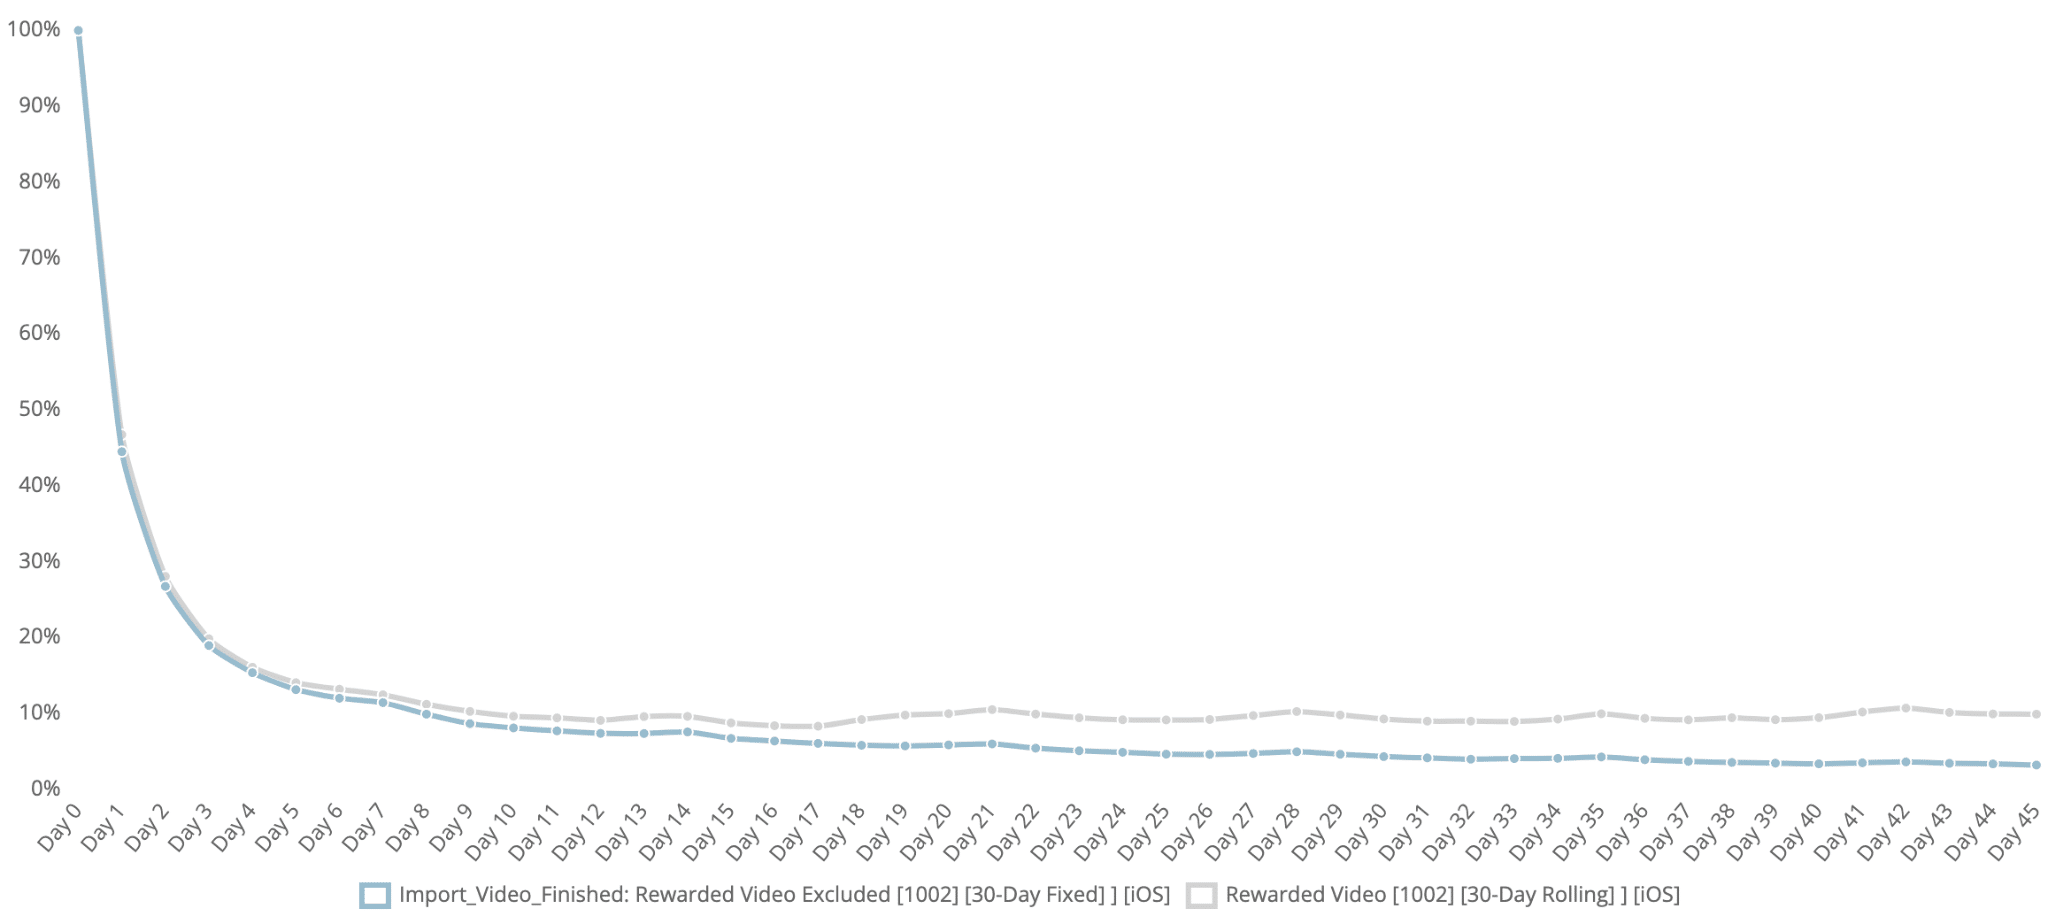
Retention: Rewarded Video cohort (grey) showed immediate improvement on D1 (5%) and continue to show improved retention over paywall users (blue) as time goes on to include; D3 (15%), D5 (21%), D7 (31%), D30 (95%), etc.
Any improvement in retention is a big win and that is especially true for FlipaClip as our goal is to provide the best possible animation and rotoscoping studio for our creators, even if it means a loss in revenue.
Retention Rate (Zoom)

Retention: D6-7 retention change of Reward Video (grey) jumps from +5% to +30%
But from D6 to D7, we noticed a notable increase in retained creators on the Reward Video users likely meaning we have opened up a very attractive, previously unutilized feature to our creators. These results indicate keeping this feature paid-only– while generating revenue to the company – was likely reducing overall user engagement as creators wanted to use videos longer than 6 seconds.
User’s time in app vs. install
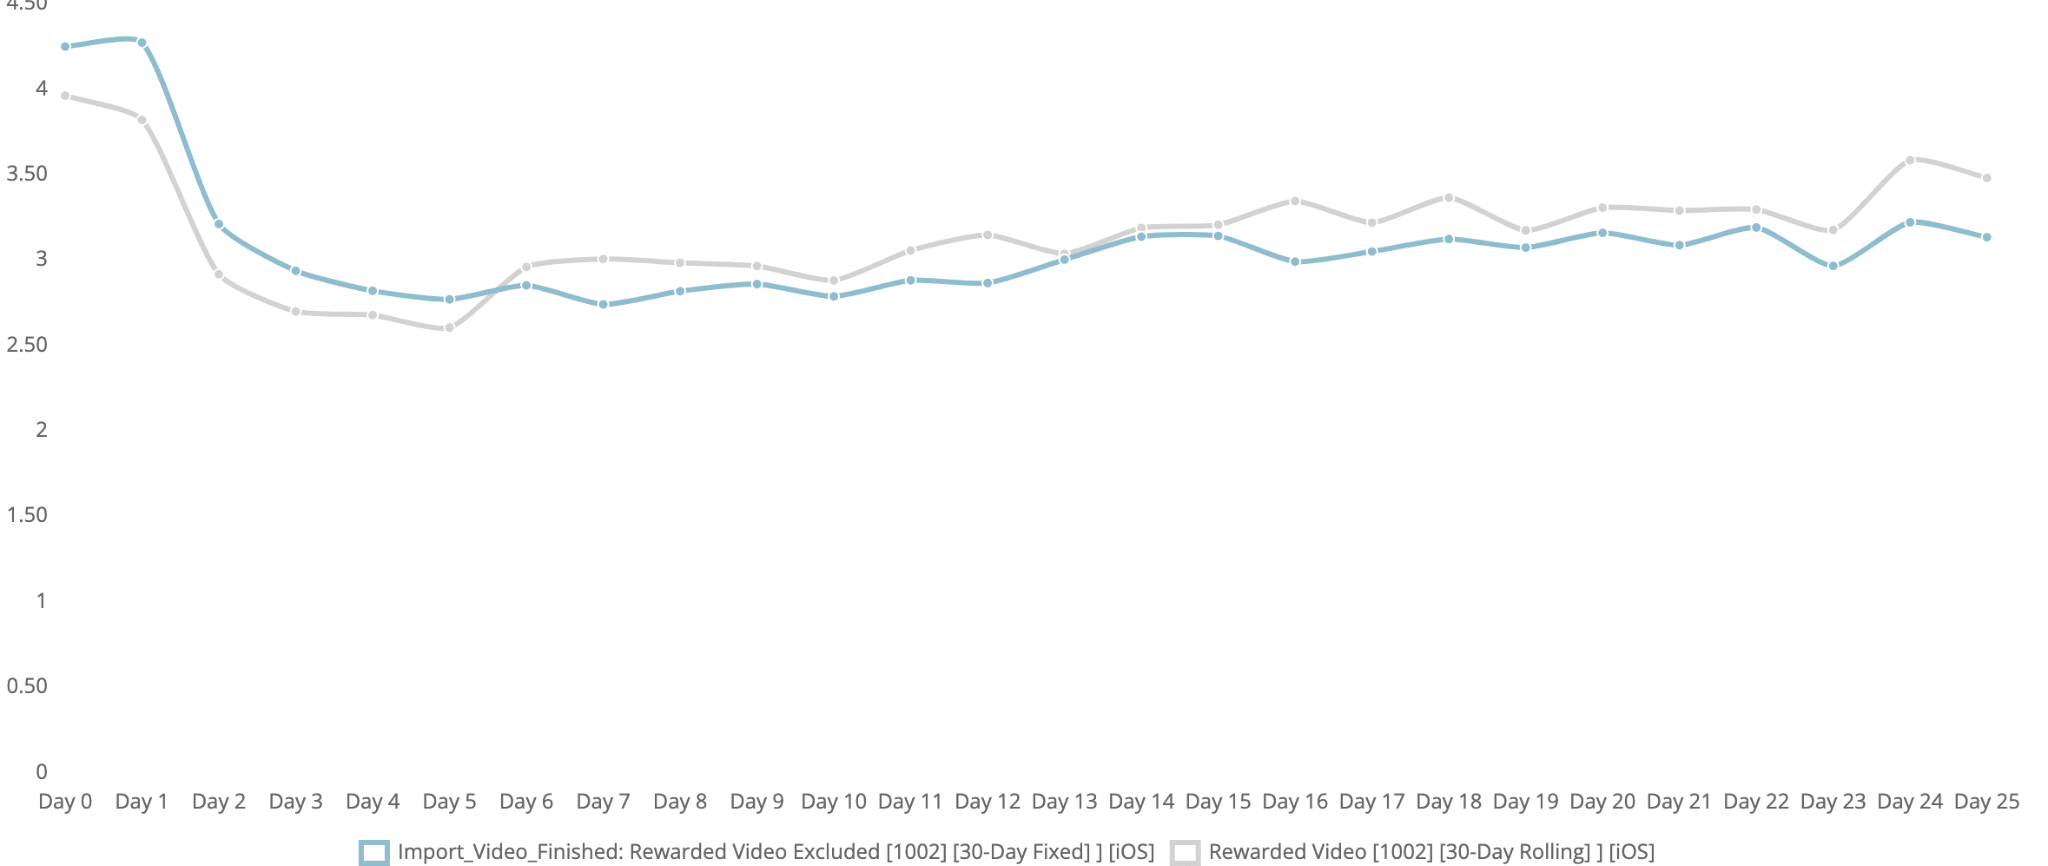
Avg time in-app (y-axis) vs. days since install (x-axis) – Paywall users (blue) vs Reward video users (grey): Reduced initial time-in-app in line with other main KPIs, but solid increase in time-in-app that accelerates over time.
The longer your video is, the more frames you have to animate, and thus you will need to spend more time in the app to work on the additional frame count.
User sessions from install
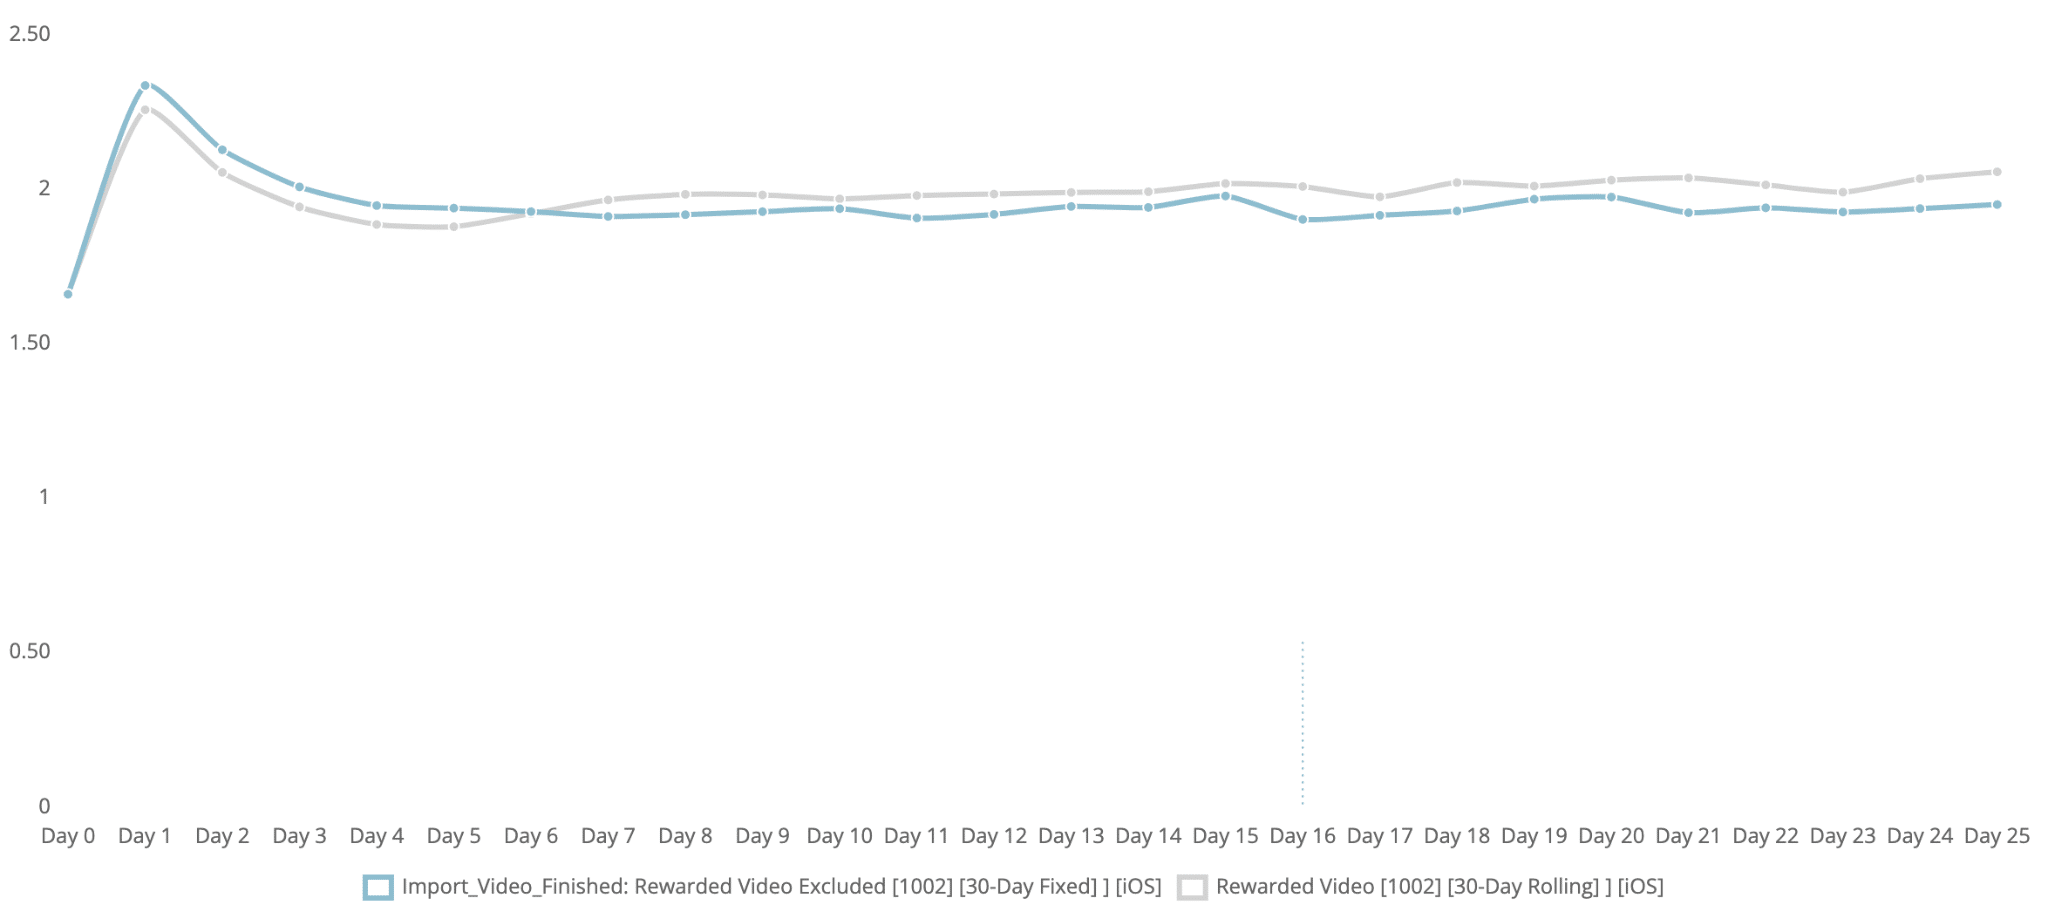
Number of daily user sessions (y-axis) vs days after install (x-axis) – Paywall users (blue) vs Reward video users (grey).
This falls directly in line with the time-spent-in-app increase in performance. If a creator imports a longer video, it takes more time and effort to complete the product. Overall, we see a more engaged creator through longer, more frequent sessions.
Daily reward video impressions
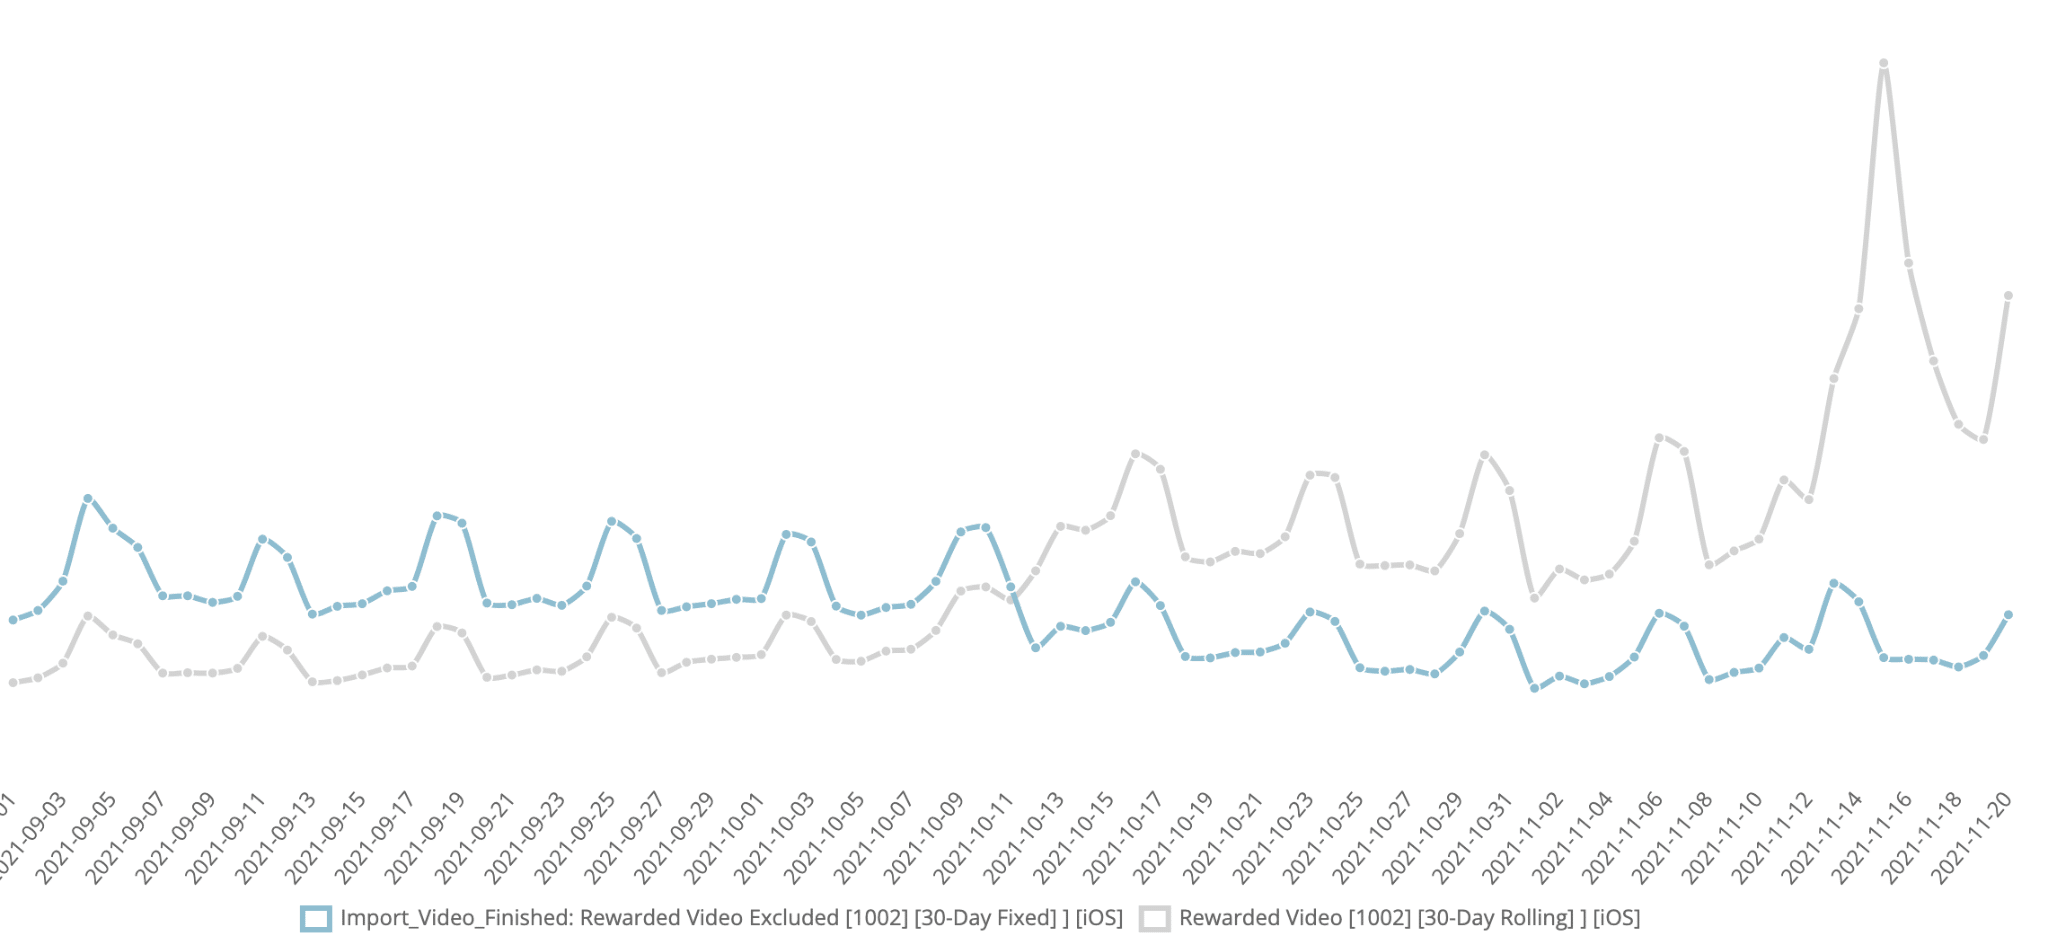
Daily Rewarded Video (RV) Revenue – Paywall users (blue) vs Reward video users (grey): As expected with the increase of feature use for import video, a significant uptick in RV impressions was rendered from the placement. Additionally, and as expected, the increase in volume also led to an increase in CPM’s as our demand became more utilizable from advertisers looking for scale.
IAP conversions vs. install day
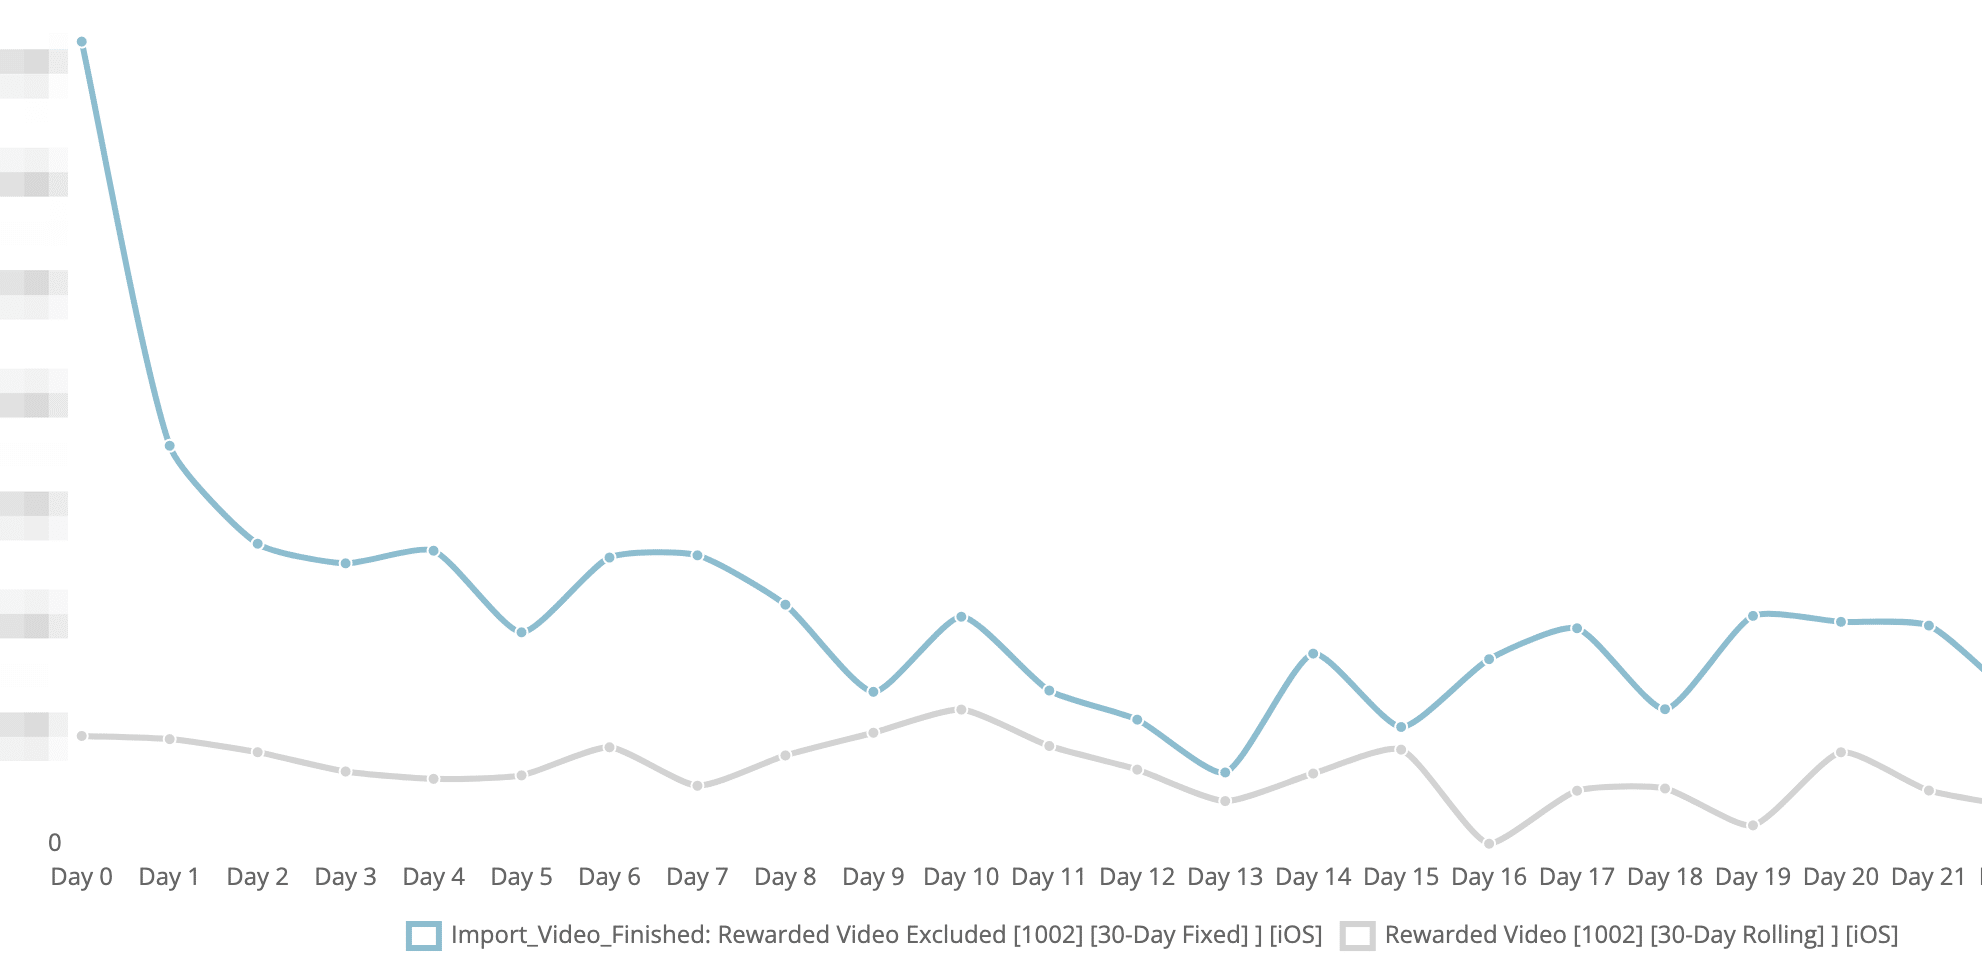
Avg. in-App Purchase (IAP) Conversion Rates for feature (y-axis) vs. days after install (x-axis) – Paywall users (blue) vs Reward video users (grey): Decrease in IAP conversion rates for the cohort of creators interacting with RV import video vs baseline.
Initial conversions dropped substantially (7x) to the point whereby the RV revenue lift was not enough to balance ARPDAU and short to mid-term LTVs. It would take ~60 days for the average RV user to match the LTV from the IAP cohort.
LTV vs. install day
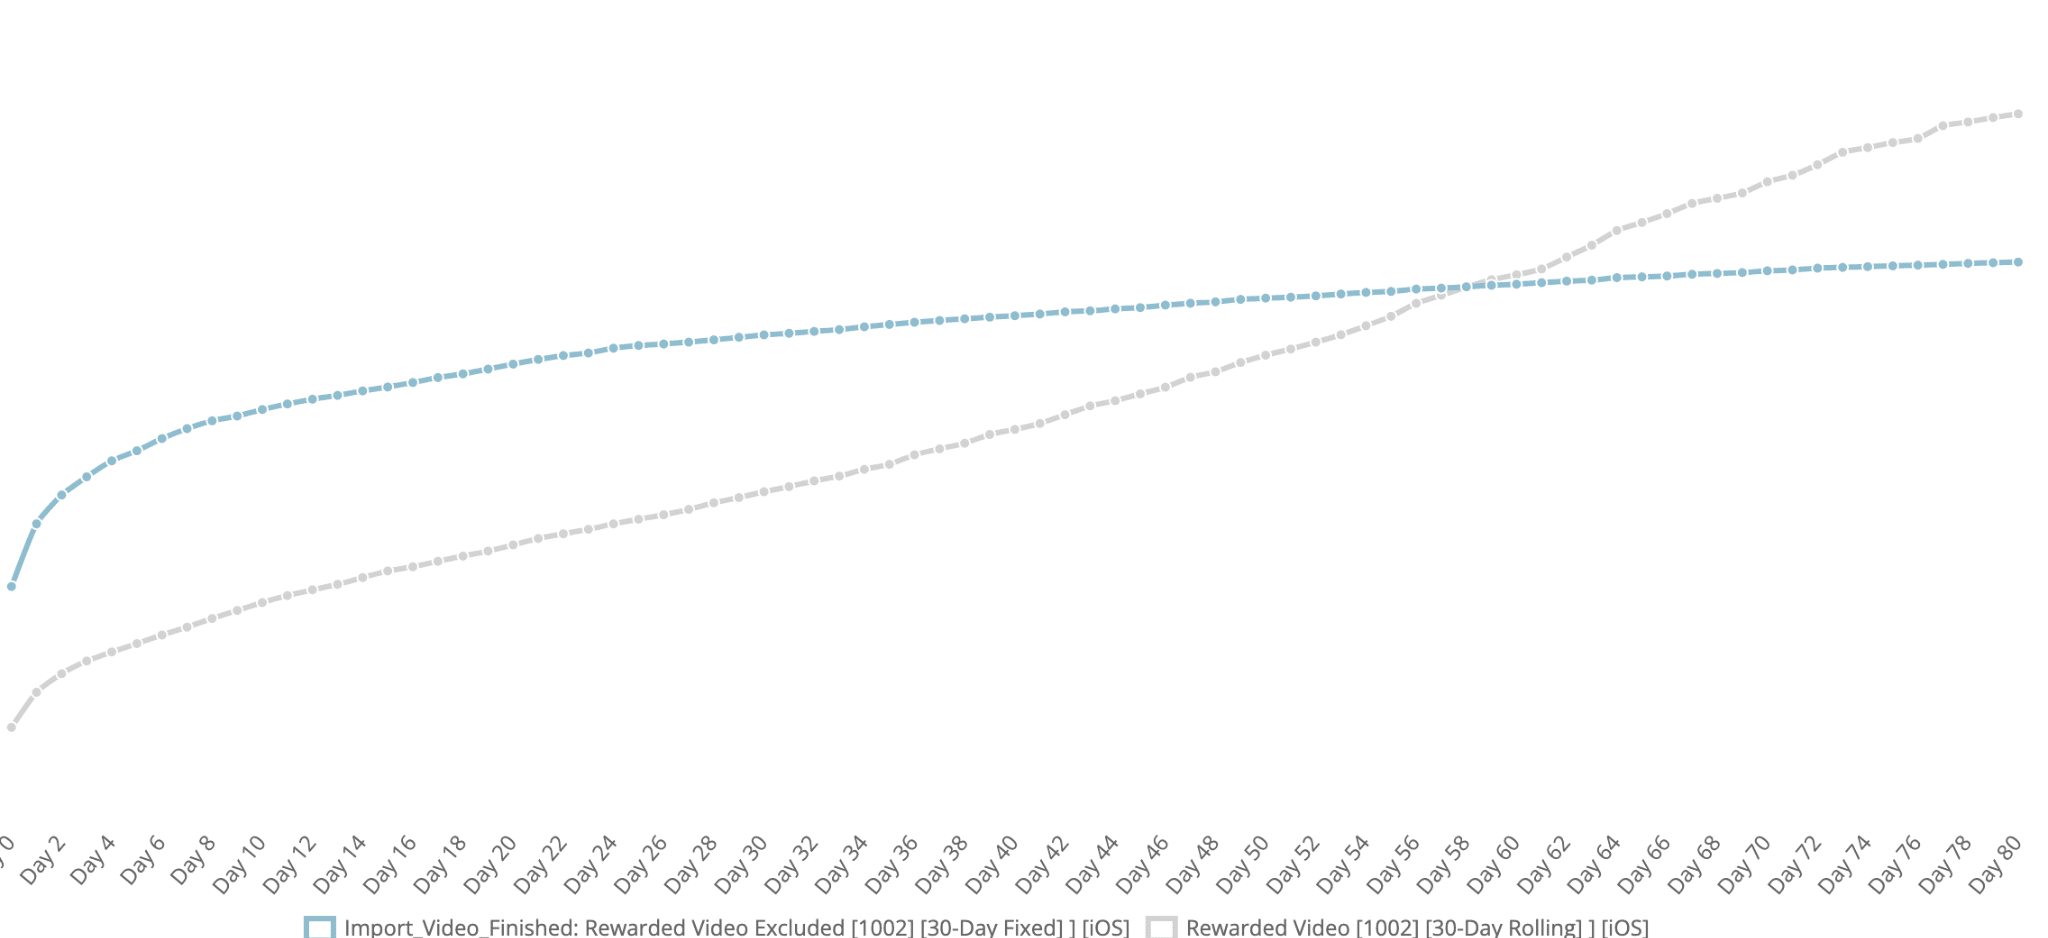
LTV of users (y-axis) vs. days since install (x-axis). Reward video users (grey) start lower from lost IAP revenue of paywall users (blue) but with higher retention and video engagement more than make up LTV by day 60.
Which, from a black and white perspective, would eventually be worth the hit (although painful to lose the IAP revenue) purely because of the improvement in retention and user experience.
However, when reviewing the D0-D4 conversion rates, there was clearly an opportunity to salvage some, if not most of that lost IAP revenue.
Highlighting majority of IAP conversions
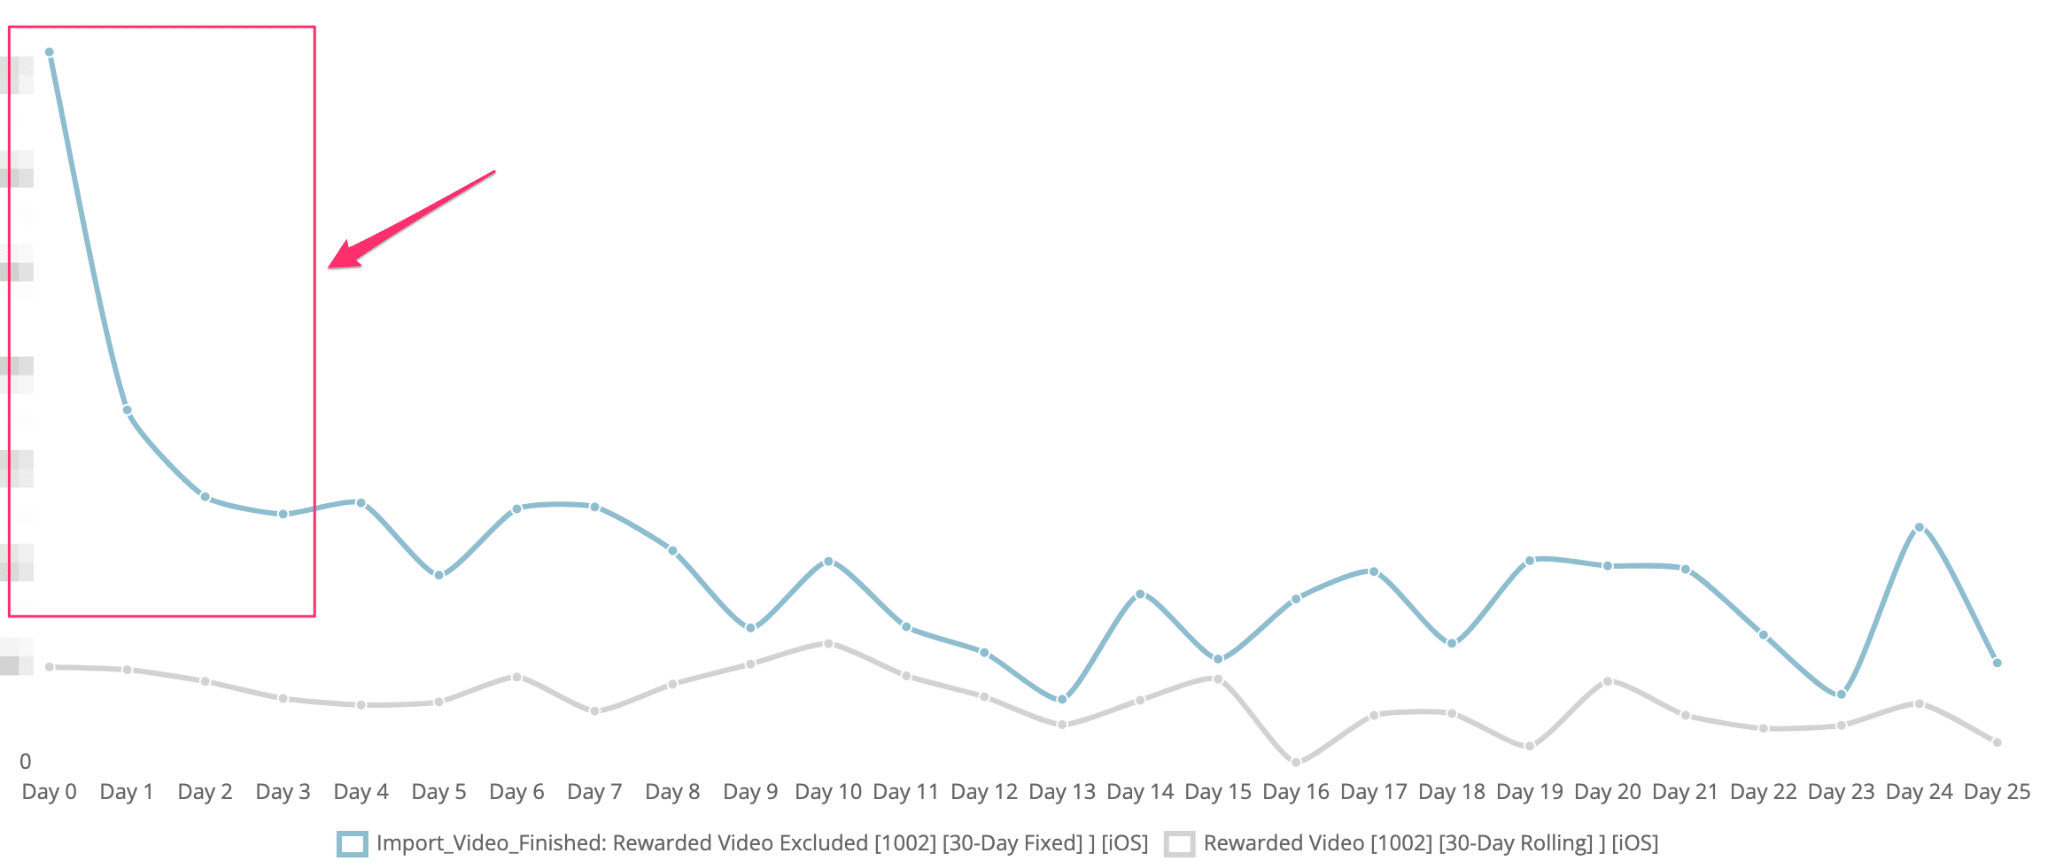
IAP Conversions (y-axis) vs. days after install (x-axis) where blue users (Paywall) show a higher per-user conversion vs. grey users who can unlock with a reward video.
Looking at the graph above, the majority of purchases come within the first four days from the user’s install. It’s worth noting at this point we have a very diverse creator base and we regularly segment measurements of users by age groups, behaviors, geos, and device type, so below, we broke out the conversion results into our key core segments for differentiation: age group, device type, and geo.
Conversions from day of install by user groups
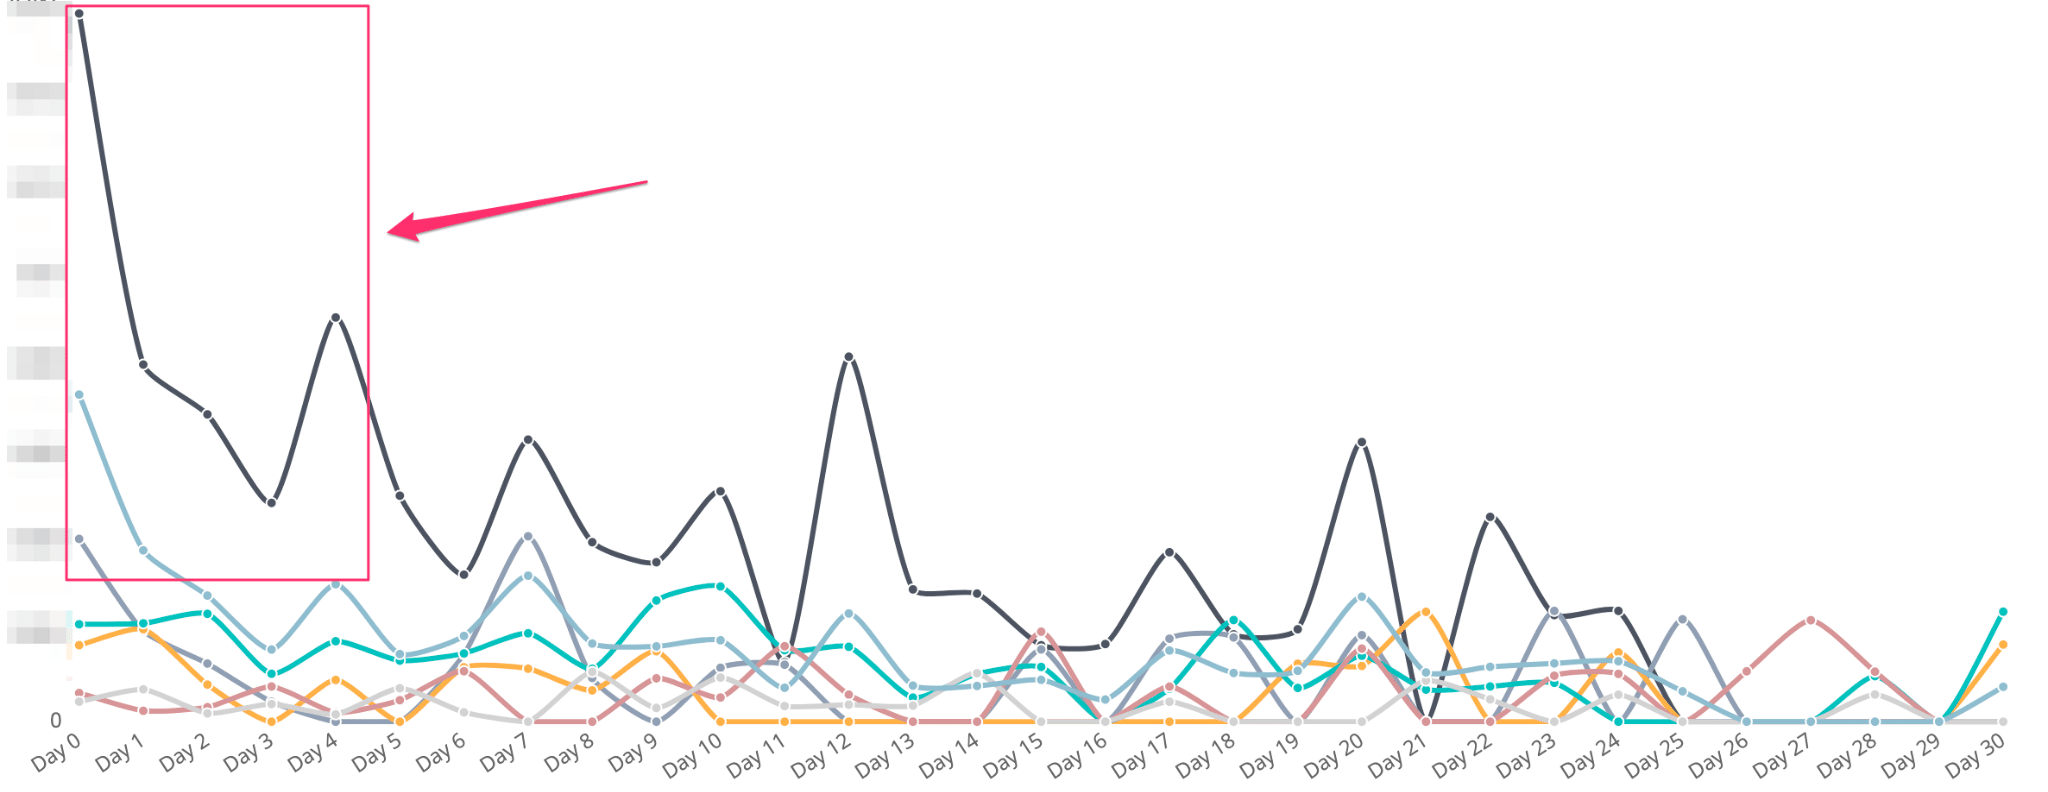
Conversions (y-axis) vs. days after install (x-axis) for various core segmented users.
The results pointed to a core creator group that was responsible for the bulk of the purchase revenue. This prompted us to delay offering the reward video option until after the first ~4 days of usage to just the core creator group. And just like that we’ve created a dynamic app experience. This change allows us to capture the majority of the IAP and allows us to capitalize on RV revenue, maximizing revenue and user experience for all creators.
Key Takeaways
Our three pillars of growth are engagement, user acquisition, and monetization. All of which work together in conjunction with onboarding. When building out our product and the associated user journey, it’s important to take monetization and growth strategies into consideration. Thus, monetization logic should not be viewed in a vacuum.
Given the complexities of planning and testing monetization strategies, it is not enough to look at just the standard metrics like retention, ARPDAU/MAU, and LTV. It is critical to take the entire user journey into consideration because small changes can have big impacts, which are not reflected in the core metrics. Any key event-driven KPI should be looked at from a functional, funnel, and relative reporting perspective. We can achieve huge wins with a bit more context by breaking down the user experience and revenue path.
By closely analyzing key event KPI’s, we were able to: redefine a new monetization path (rewarded video vs IAP paywall), significantly improve revenues, improve user experience, improve key event KPI’s (per-user avg), and most importantly, identify a highly desirable feature of the app with huge engagement and viral hook potential.
About the Author:
Geoff Hladik manages monetization and growth for Visual Blasters, the company that makes FlipaClip. Prior to working on the content side, Geoff cut his teeth on mobile ad & marketing tech with roles at InMobi, Fiksu, Appodeal, and Apptopia.
You can connect with him on LinkedIn.


