Predicting campaign performance for apps supported by in-app advertising.
This week a great piece by Eric Seufert covered the future of app marketing but I couldn’t shake a creeping sense of familiarity in how the messaging largely focused on apps that monetize mainly via subscriptions and in-app purchases (IAP). It’s not surprising, besides hyper-casual games, many apps view IAP as the priority and in-app advertising as the distraction. Consider the tweet referenced in the article:
An aspect of digital marketing that isn’t fully appreciated is how *rare* of an event a purchase conversion is. The ability to target against historical purchase conversions fundamentally changes the distribution of value for audiences.
— Eric Seufert (@eric_seufert) March 10, 2022
This statement is very true for apps that make the majority of their revenue from IAP, but for apps that monetize through IAA, it’s a different story entirely. While both models focus on monetization “events,” a purchase event is magnitudes more valuable — and relatively rare– when compared to a monetizing ad impression event.
Consider a user who costs $1 to acquire. That user would need a single $1 IAP to break even (net, we’ll disregard app store margin in this example). In an ad-supported model, the same user would need to see 100 to 1000 ads to achieve the same ROI (at $10-1 CPMs respectively). This changes measurement from focusing on a single monetization event to instead incorporating hundreds or thousands of unique events for a single user.
With an order of magnitude more monetization events, small amounts of users will statistically be less important in driving long-term success for some campaigns. Don’t get me wrong, especially for games that rely heavily on Ad Whales, a few users can make large differences. But statistically, you’ll less likely have a single user drive a cohort’s success. In addition, while purchases often happen in the first few days, ad impressions are spread over the lifetime of a user, meaning each user of IAA monetization will likely take much longer to achieve payback.
With ads, averages ARE important. But so is segmentation.
All this means IAA-supported apps need to measure and predict campaign performance differently: more users, over a longer period of time, with more monetization events. Therefore, obtainable marketing goals are more likely to rely on average-based measurements (ARPU, LTV) of user performance to confidently understand the earning potential for fat-tailed distributions.
That’s not to say an average will tell you the whole story, segmentation is very important to identify as campaign performance may vastly differ. Consider the following example of an app’s campaign source measurement: same curve, very different outcomes.
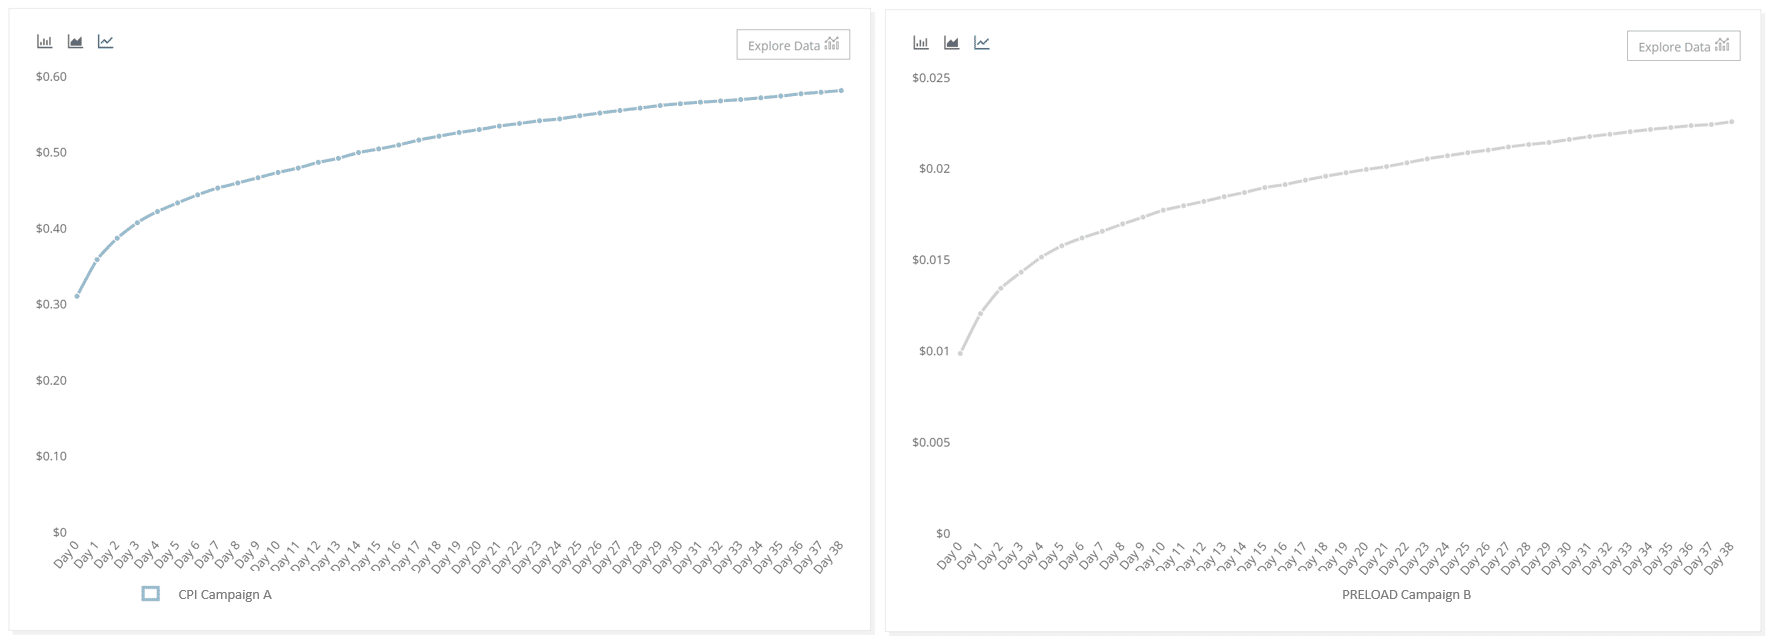
Same app, different acquisition source. Similar LTV maturation models, similar user churn, similar campaigns?
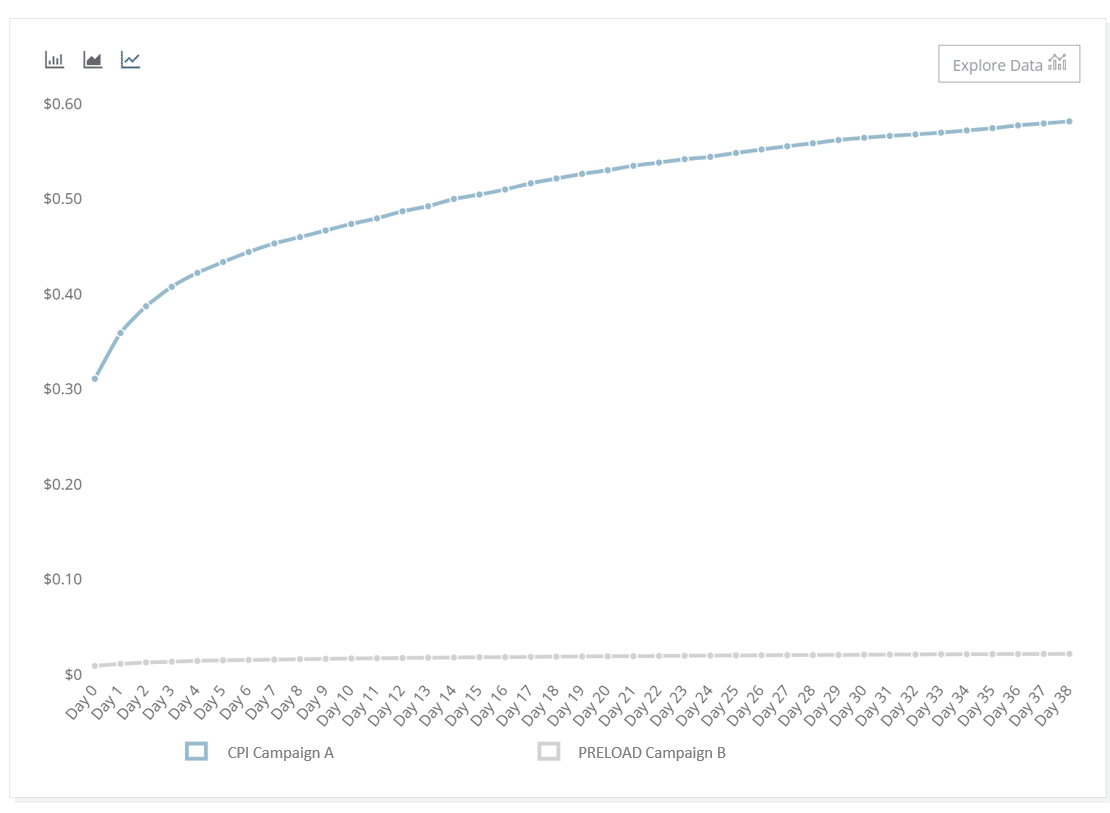
Only when you put the two on the same axis do you see the stark difference in campaign performance.
Achieving confidence in your measurements
Every marketer needs to act on performance quickly, the downside of having so many monetization events, spread out over so much time, coupled with a high user churn is it becomes easy to unknowingly lean on small numbers to make big decisions.
Consider a very normal retention curve below: 397K users install when the report was run only 18K users were mature and active. This means the final 10 days of your LTV curve – which is instrumental in future predictions– is based on <5% of your original cohort.
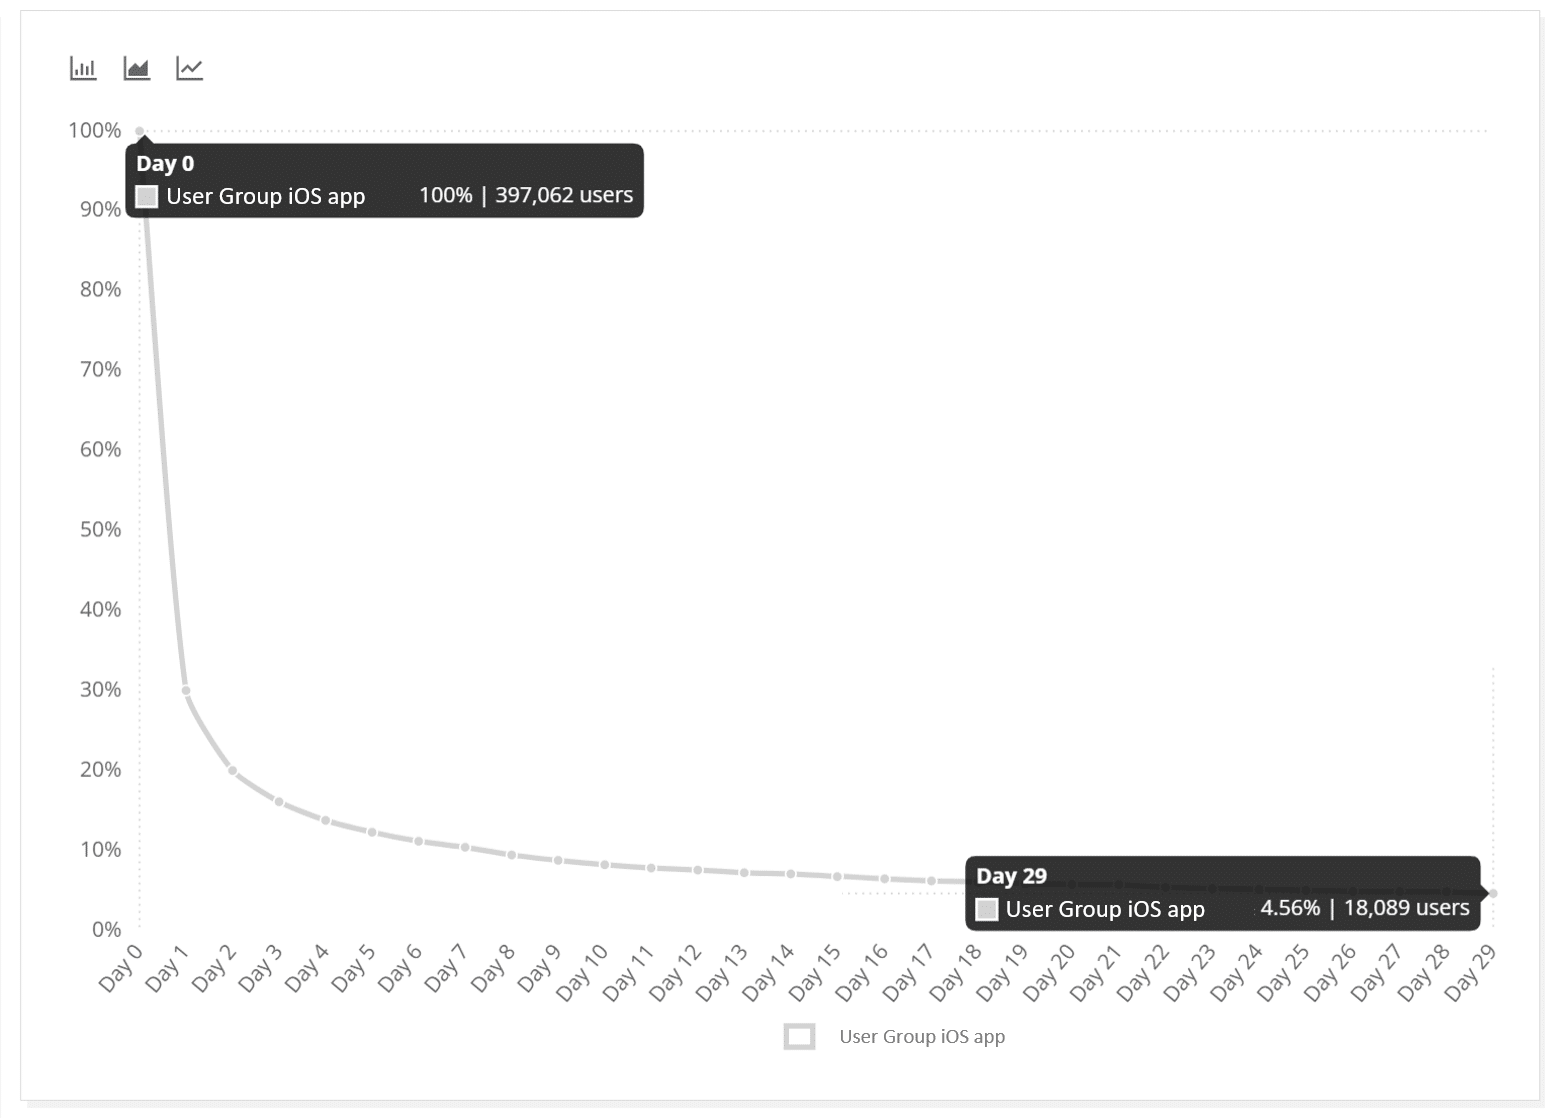
This isn’t hyperbole, performance marketing managers deal with these types of challenges on a daily basis. To help gain confidence in small samples, marketers employ tools to help understand variance in user performance. Below is an example of a spread of cohort variance, showing the dispersion of 95% of individual cohorts (2nd standard deviation).
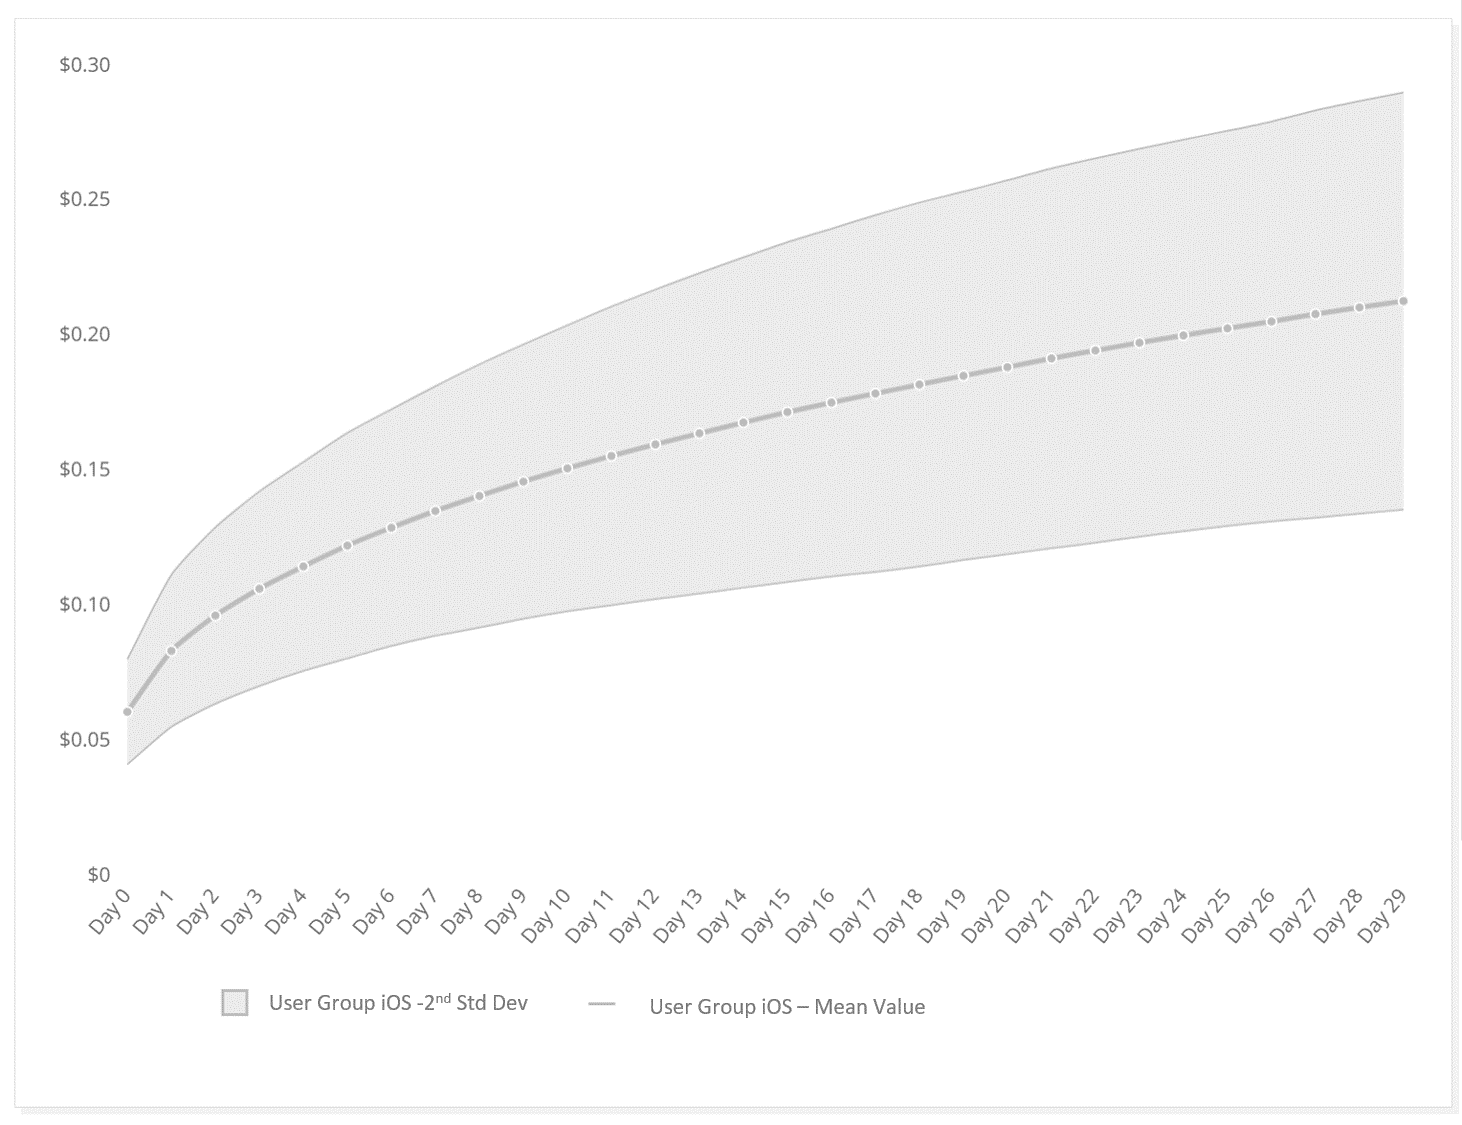
The above diagram shows the 2nd standard cohort deviation compared to the LTV mean. In this example, 95% of cohort LTVs range +/- 40% from the mean. Does that variance give you confidence in predicting a future cohort’s value?
Standard deviations and standard errors will help you understand how likely your predictions will be repeated and how likely a single sample will apply to the mean value. But understanding how variance impacts predictability doesn’t stop at marketing. When product teams employ changes via AB tests, it’s tempting to call a test based on an early mean value. But the truth is, measuring confidence (p-value) in the test’s outcome can help you understand the repeatability of the results and help you determine whether to trust the outcomes of the test.
Monitoring and revising your measurements
App developers who rely on IAA have their war stories on rapid swings in CPM – coming from seasonal changes or even from a single targeted ad campaign. Add in the pervasive inconsistencies in campaign performance and you have the capacity for extremely volatile campaign performance. It’s important to stay abreast of changes in pricing and performance to keep your campaigns running and avoid losing money.
In addition to monitoring for performance changes, we find that historical learnings can help you refine your prediction model as well as add some confidence in your predictions. You can understand how accurate your predictions are as well as build better forecasting models for your historical data.
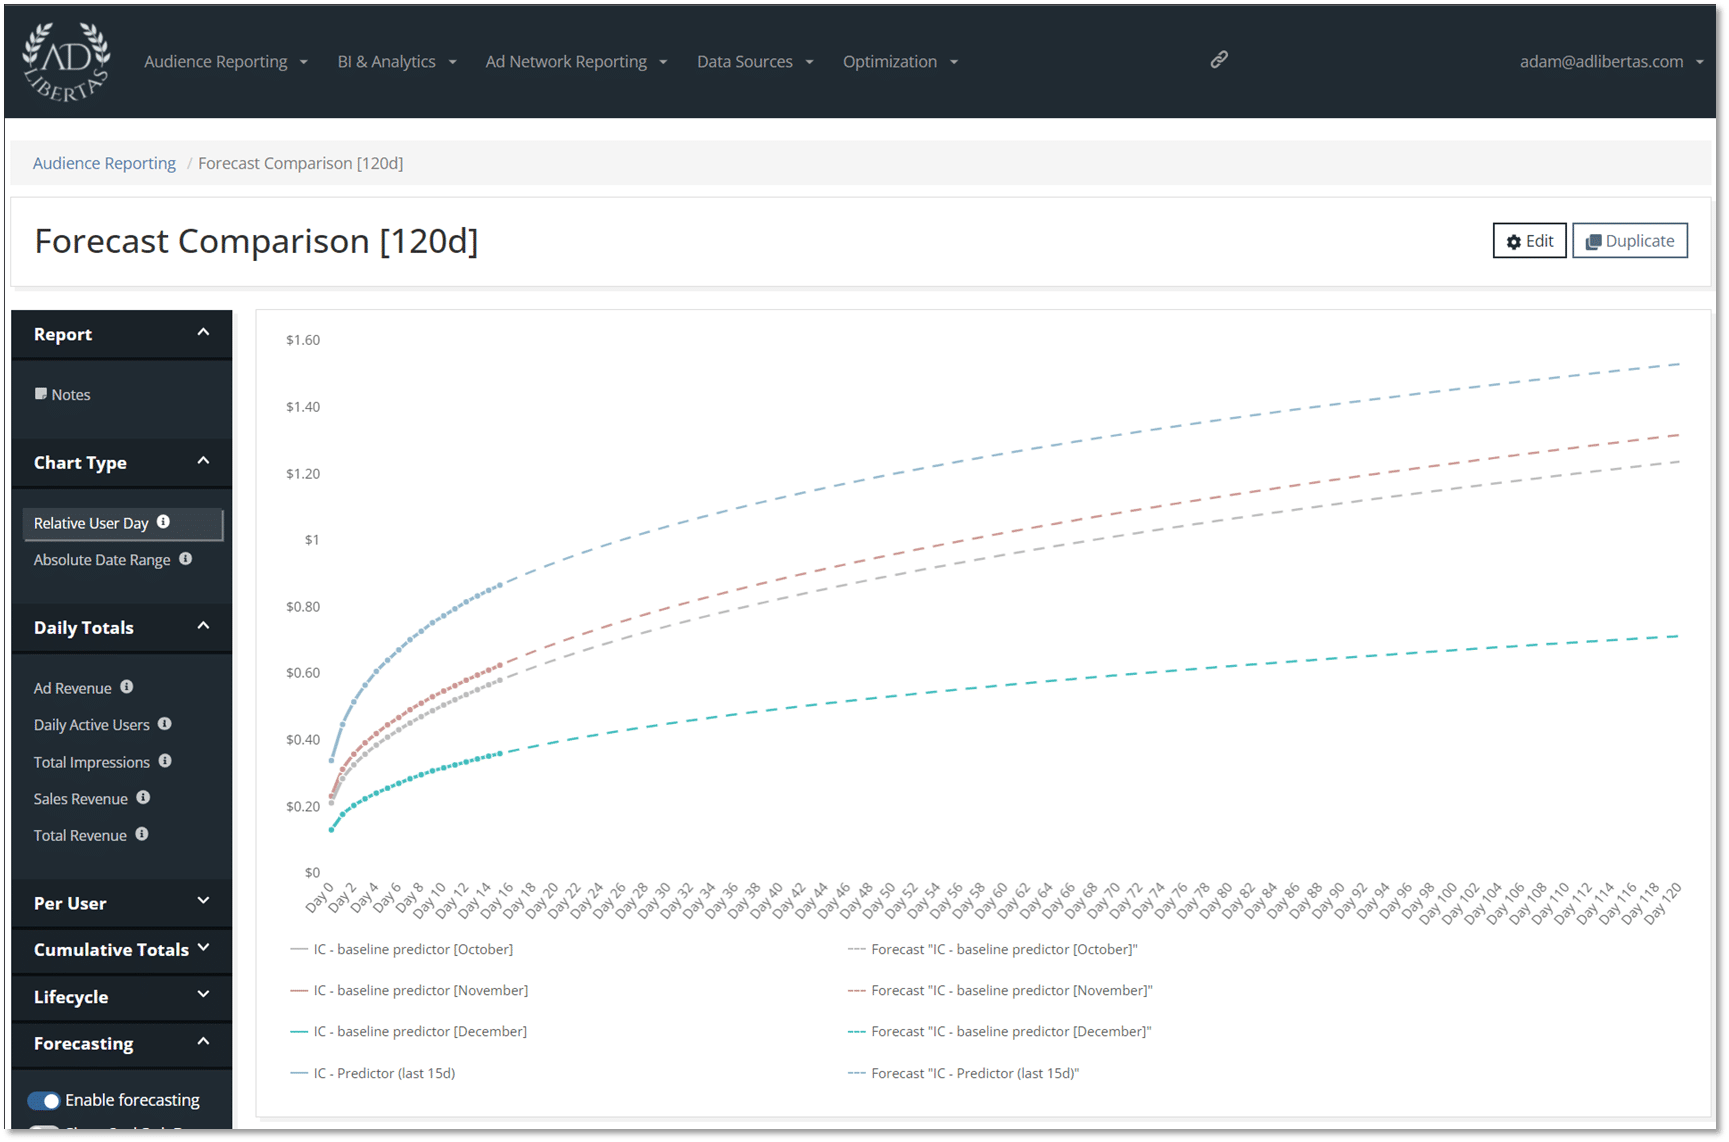
Above are pLTVs of users on the same app separated by install month. If you’re not tracking user performance you could miss an opportunity in increasing user performance allowing you to increase budgets.
Looking ahead: Post ATT, early success indicators will increase in importance
With Apple’s deprecation of the IDFA and Google’s planned deprecation of GAID, user identification by campaign source is projected to become much more difficult. Most experts agree future iterations of ATT will vastly decrease user-level campaign visibility.
As a result, the onus for campaign success lies on the app developer. Specifically, the app developer must “bucket users into LTV ranges in real-time, and to update those estimates within some conversion value window so as to send the most reliable, most recent LTV range estimate within some amount of time after install.” (Seufert). We cover some example methods for accomplishing this for ad-supported apps in our article “how to calculate the LTV of a user on their first day”.
An important corollary here, you don’t necessarily need to find the reason why users are worth a value, just an early event indicator of value because ultimately the reason for user value doesn’t matter as long as you can predict it. An example is Big Duck Games who used day-1 puzzle completions as their method for determining user value.
Apps that monetize with ads are often overlooked when compared to high-grossing subscription and IAP giants. The complexity and unpredictability make for a difficult business model. That said, it’s not all bad news, there are plenty of successful apps that do very well with their limitations. If you’re interested in learning more, we encourage you to learn from some of our customer case studies.


