Using in-app events to predict user-behavior and value.
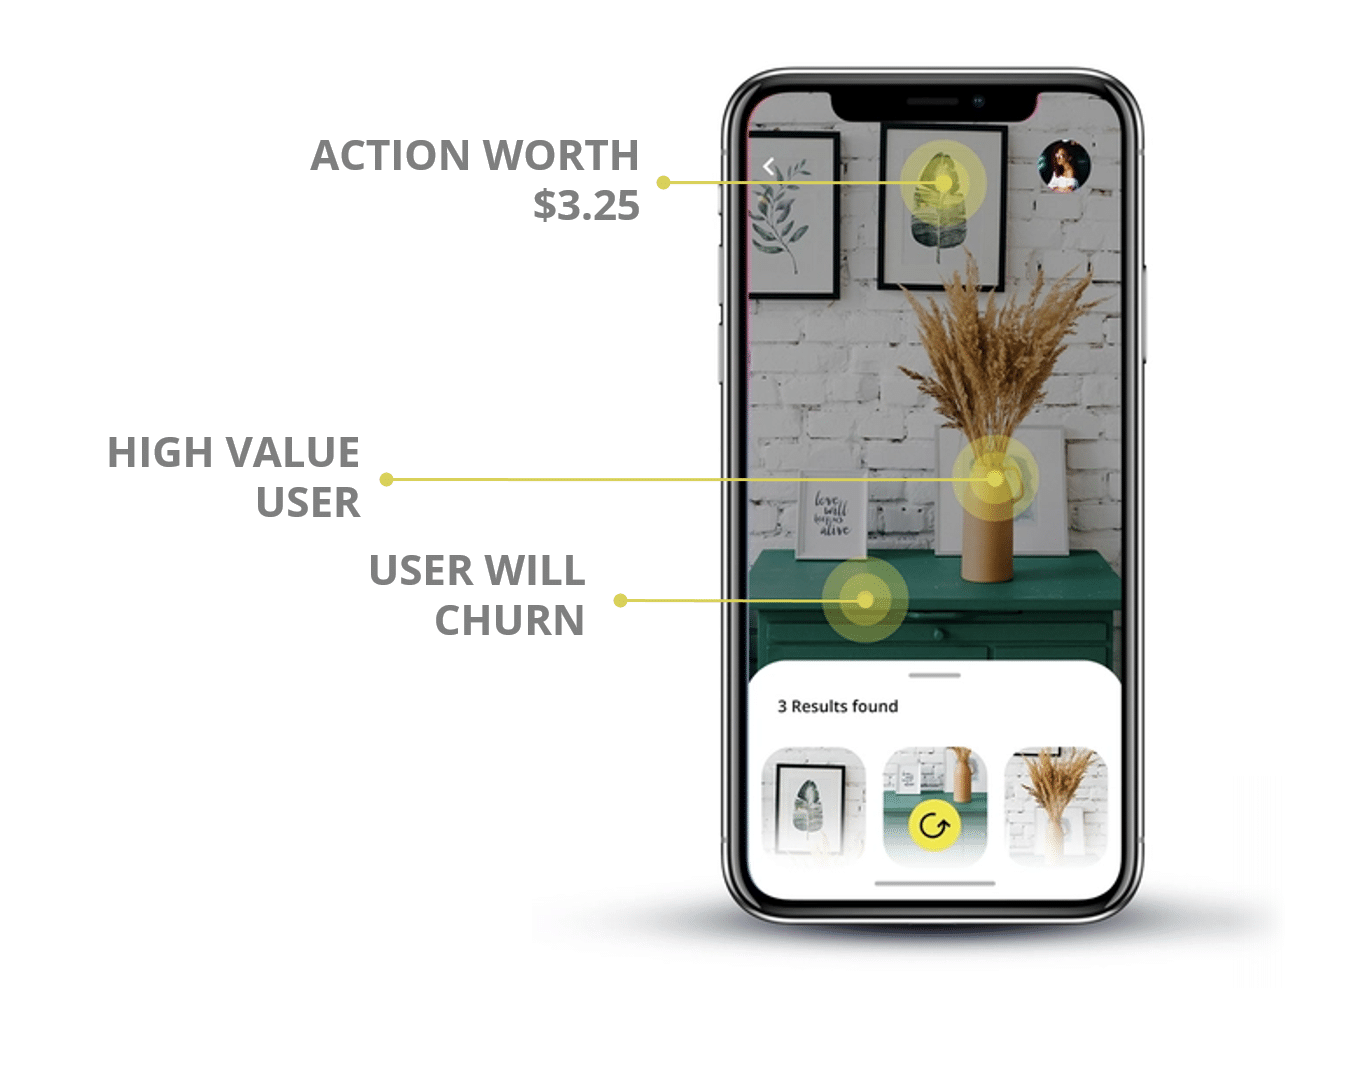
Most apps have a wide variety of features, functions and users. So at first it may seem impossible an event will predict a user’s behavior, or an action that will determine the eventual lifetime value of a user. But it’s not.
User-analytics is the measurement of user’s behavior, engagement and experience with your app. With the proper testing, measurement and iteration, user events can help you predict the user’s behavior and eventual lifetime value (LTV) in your app.
Being able to predict user-behavior and LTV of users in your app will help you:
– Predict Churn: Identify the events (or missed events) indicating a user will leave your app.
– Increase Per-User Earnings: Find user events that indicate—and lead to– high-value (LTV) users.
– Increase the effectiveness of user acquisition: Put a definitive dollar value to in-app events (aka conversion values) of users coming into your app.
So how do you go about using app events to predict user behavior & value? We’ve put together a four-step guide to finding, measuring and refining your app’s events with the hopes you too can start to quantify – and predict –user behavior.
Step 1: Understand existing app events
If you’ve developed the app in-question or had a hand in designing the event-schema, this might be an easy step for you. For others this may seem daunting. As any product manager that’s stepped into a new app – or developer taking over maintenance on a legacy app—can attest, even getting a handle on existing user-events and where they are fired can be an overwhelming exercise.
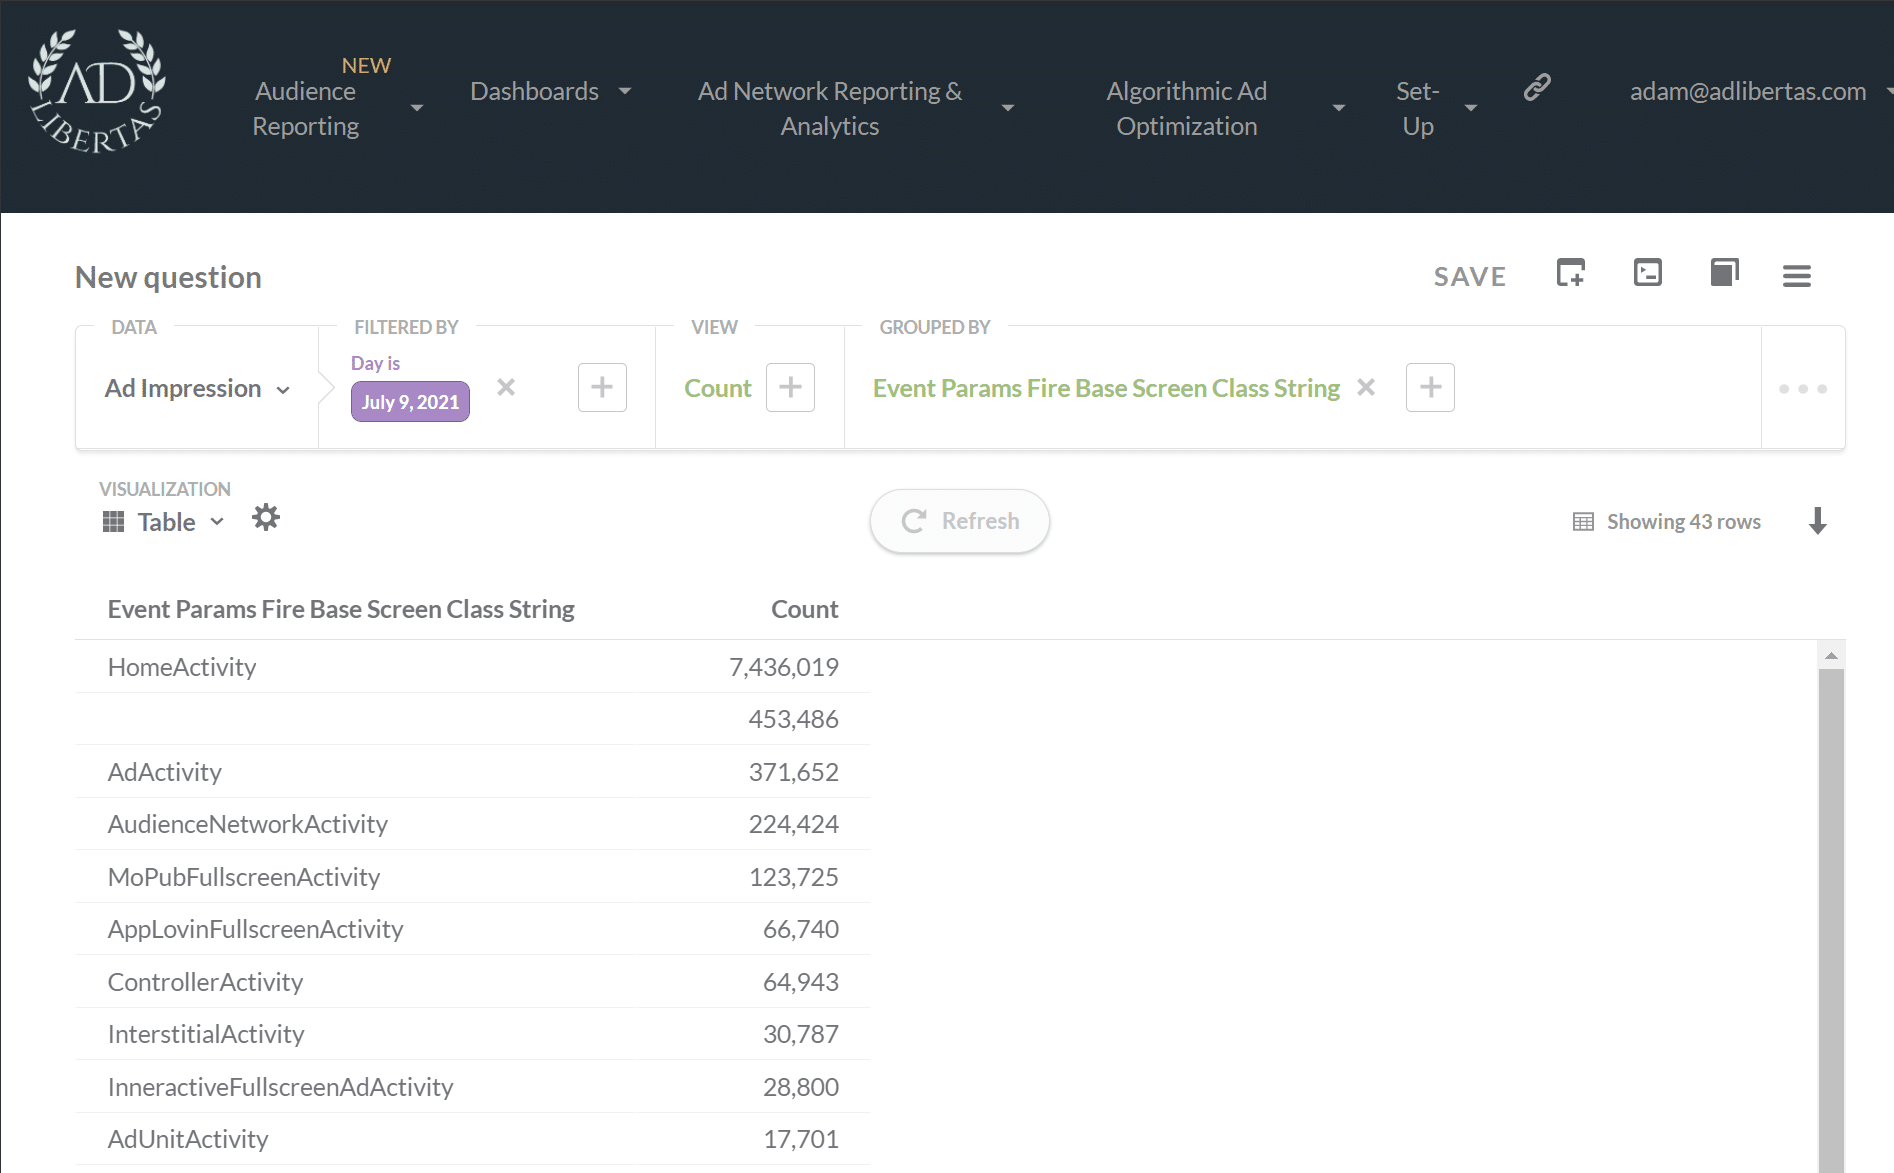
We call this step “event exploration” and simply put it’s getting an idea of what events are live, where they reside in the app, and understanding any metadata associated with the events.
Event Frequency
Determining the volume of user events is a good first step. Find events that fire often enough to create meaningful user indicators, without creating an overwhelming — and useless– majority.
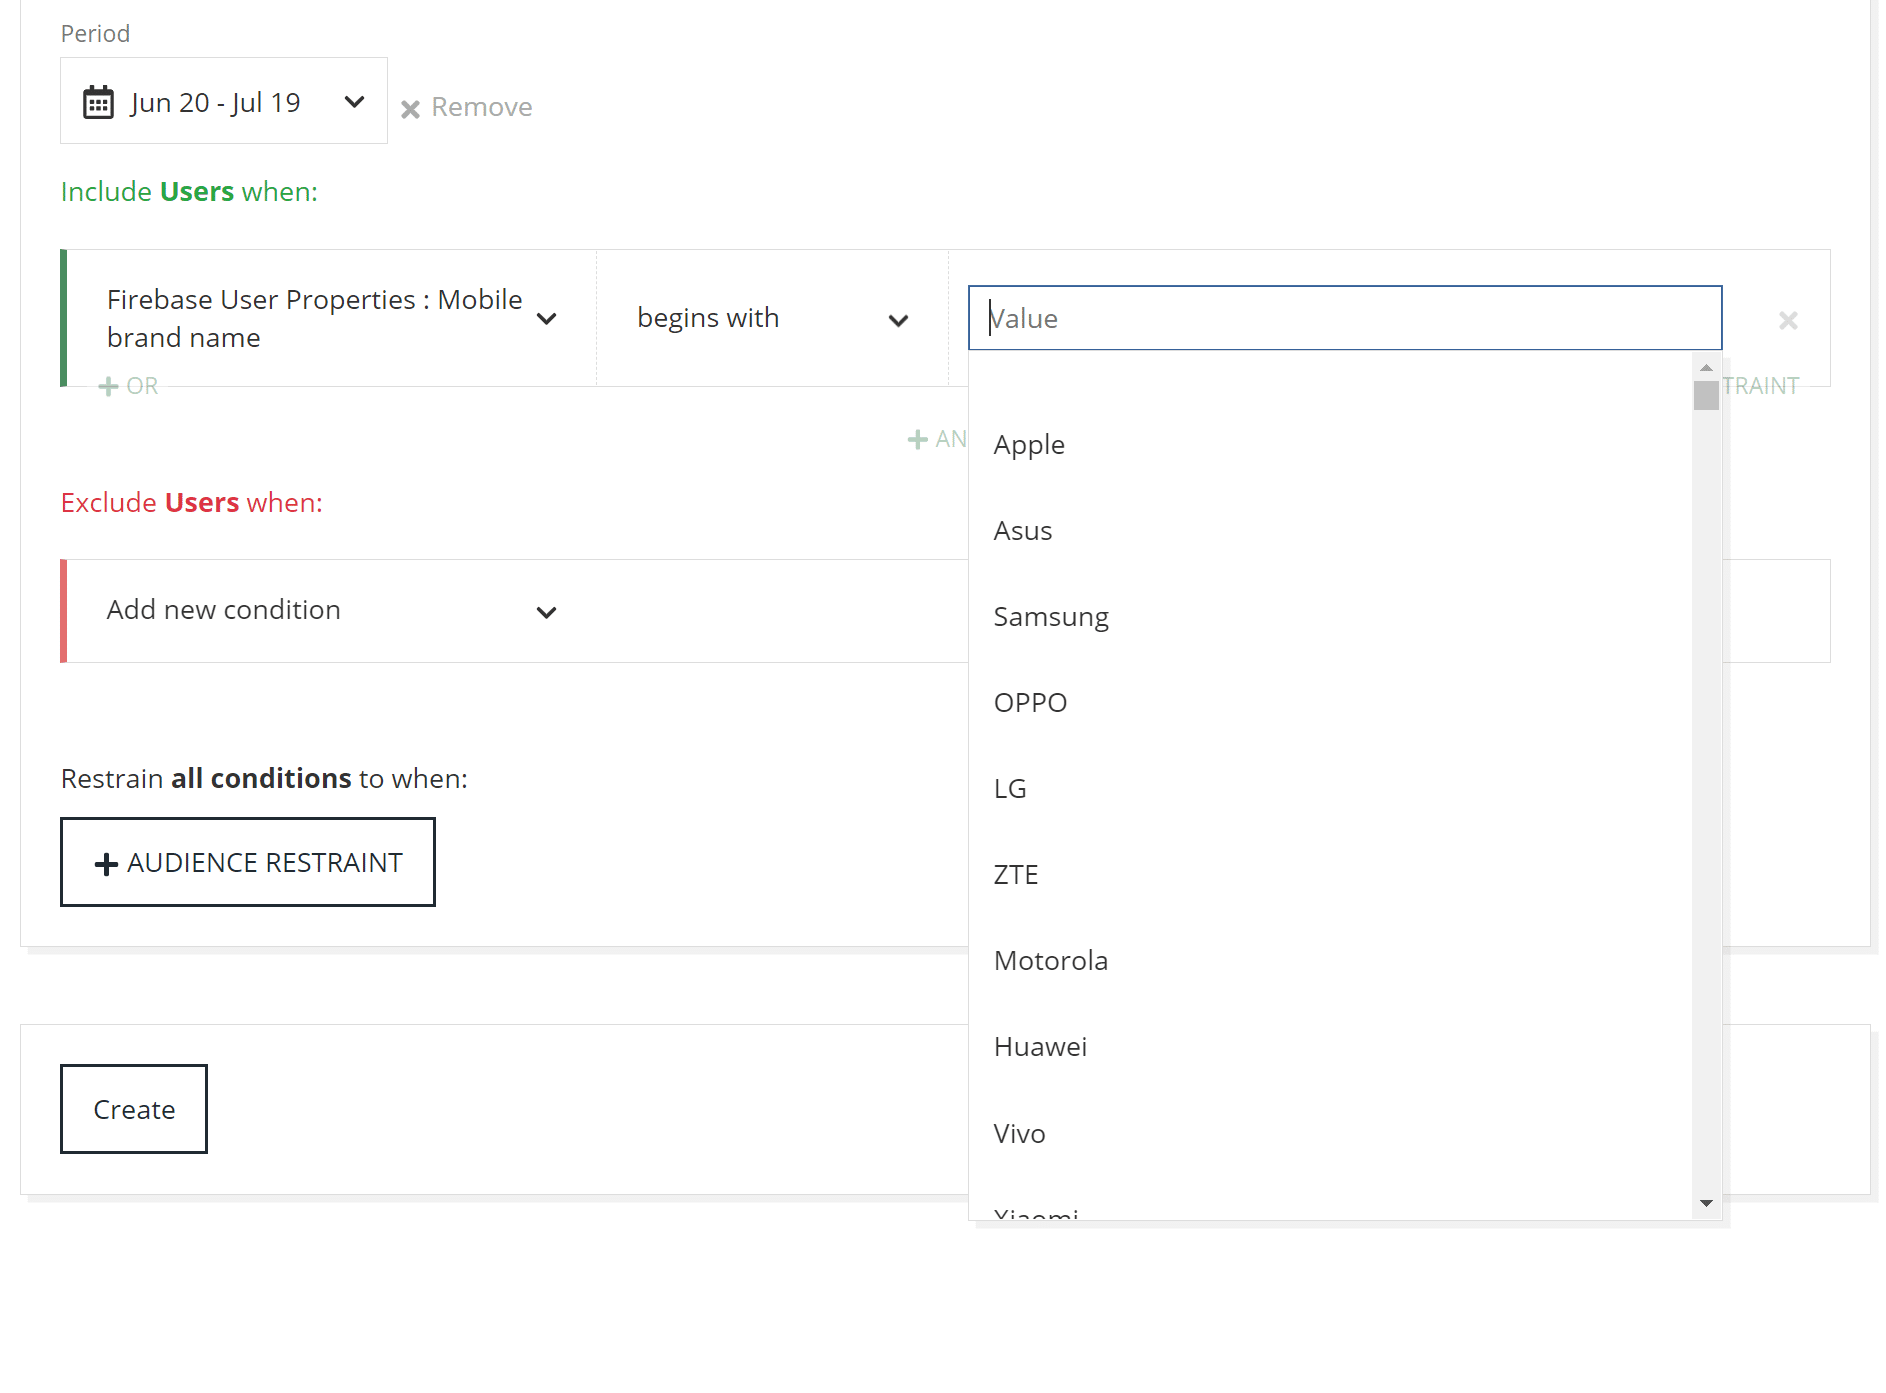
Event parameter values
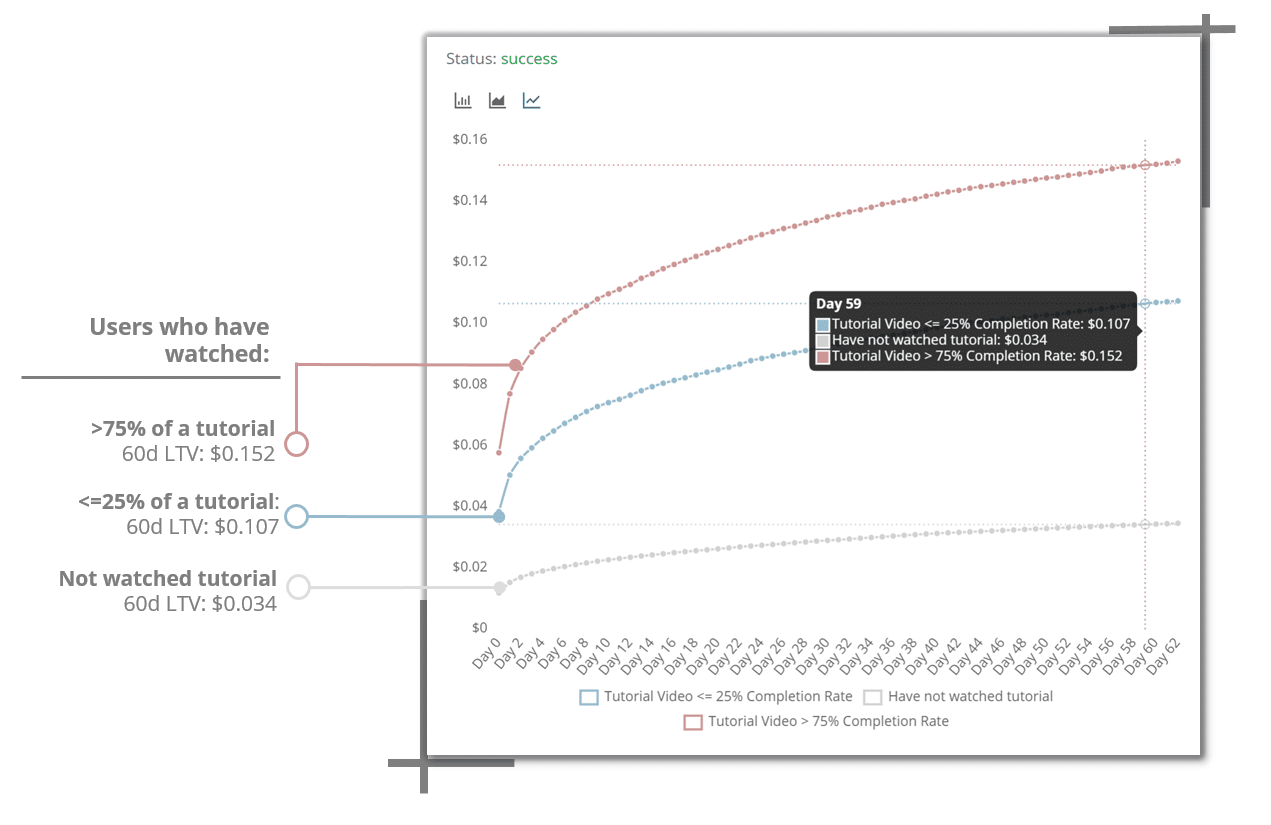
Events are usually semi-structured in format, meaning they can have a variety of metadata values associated with them. A great example is a client VisualBlasters who fires an event when a user closes a tutorial, this allows them to return — as a value parameter — the percent of the tutorial the user completed.
Step 2: Choose events that create general user-paths
Don’t let this overwhelm you. This doesn’t indicate you need to measure every iteration of a user’s journey through your app. It simply means you should start to identify “cohorts” of users defined by the events they fire and put them into corresponding buckets.
Think about a user’s flow as they install or use your app, are there any inputs needed to get full-value from the app – like a login? Are there any “indicators” of someone who’s heavily using the app, or a count of actions that indicate the user is interested?
Don’t underestimate your gut reaction on this step, you likely have a pretty good idea of some early success indicators on your app. Define 2 or more groups of users defined by their actions in the app. While you may not get it exactly right at first, you’ll be able to iterate and define better cohorts with practice.
This step is probably best defined by examples:
A puzzle-game decided to create 4-buckets defined by the number of puzzles completed on the install-day as a method for engaging user value.
A social media app created 2-buckets for users opting into ad-tracking.
An animation app bucketed users by their onboarding tutorial completion.
Step 3: Measure user actions and behaviors for each bucket
This may seem obvious, but the devil is in the details on this one. After choosing your buckets you’ll need to segment users by their actions and measure the individual performance – earnings, retention, and other actions– for each bucket.
Interested in more details on choosing the types of events for your app?
Read: “The two event-types you’ll need to accurately predict growth and retention”
The easiest way – and the wrong way— uses averages:
It may seem like the most straightforward method of measuring users is getting a simple count of users who’ve interacted with the events then applying ARPDAU averages to assign earning estimations. While this can give you a directional indication of individual bucket values we’ve seen it produce red herrings due to the vast value difference potential among users.
Consider an example: the value of a user who opts into ad-tracking. Using ARPDAU a 50% opt-in rate would indicate an equal split of revenue earned between buckets. But in fact, users who opt-in are worth 5X those who opt-out of tracking. This means 84% of the revenue is earned by 50% of the users who opt-in to tracking.
The right way: Using actual user-level revenue & retention rates
When you’re not relying on broad stroke-averages, you can get actual retention of users then apply actual user-level in-app purchase revenue and user-level ad revenue. Today most ad-platforms offer very intuitive user-level revenue APIs or events and combined with in-app purchases can give a holistic view of ad revenue per user. Using these actual metrics will give you actual user-level revenue and retention values.
The best way: Modeling out predictive user earnings over time (pLTV)
Better than actual user-level revenue? Predicted LTVs of users. This is usually achieved by applying a regressive projection model on your to-date user earnings that will project revenue out to 6 or 12 months.
Step 4: Refine and iterate
While you might make a good gut guess on how events impact user behavior you shouldn’t think you’ll get it perfect on the first try. Depending on your goals you’ll want to broaden or shrink your user pool to find the best actionable step from your findings. Let’s walk through some specific examples using a customer case study: Big Duck Games longtime ubiquitous hit Flow Free:
Finding events that indicate churn:
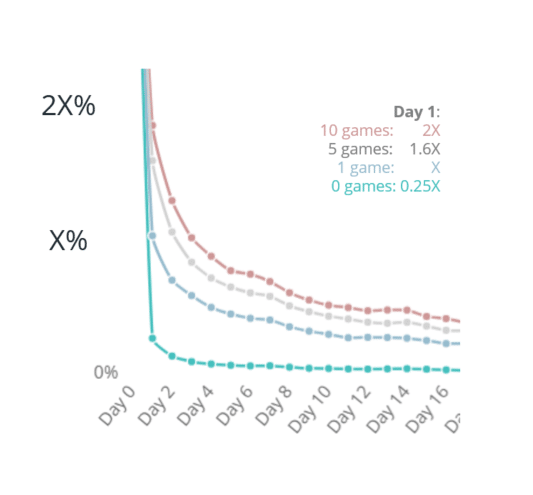
Most apps have a steep user drop-off after a user’s install date. Iterate your buckets to find events tied to the user’s interaction on the first day, or the first user session can help you compare against the second day’s returning users.
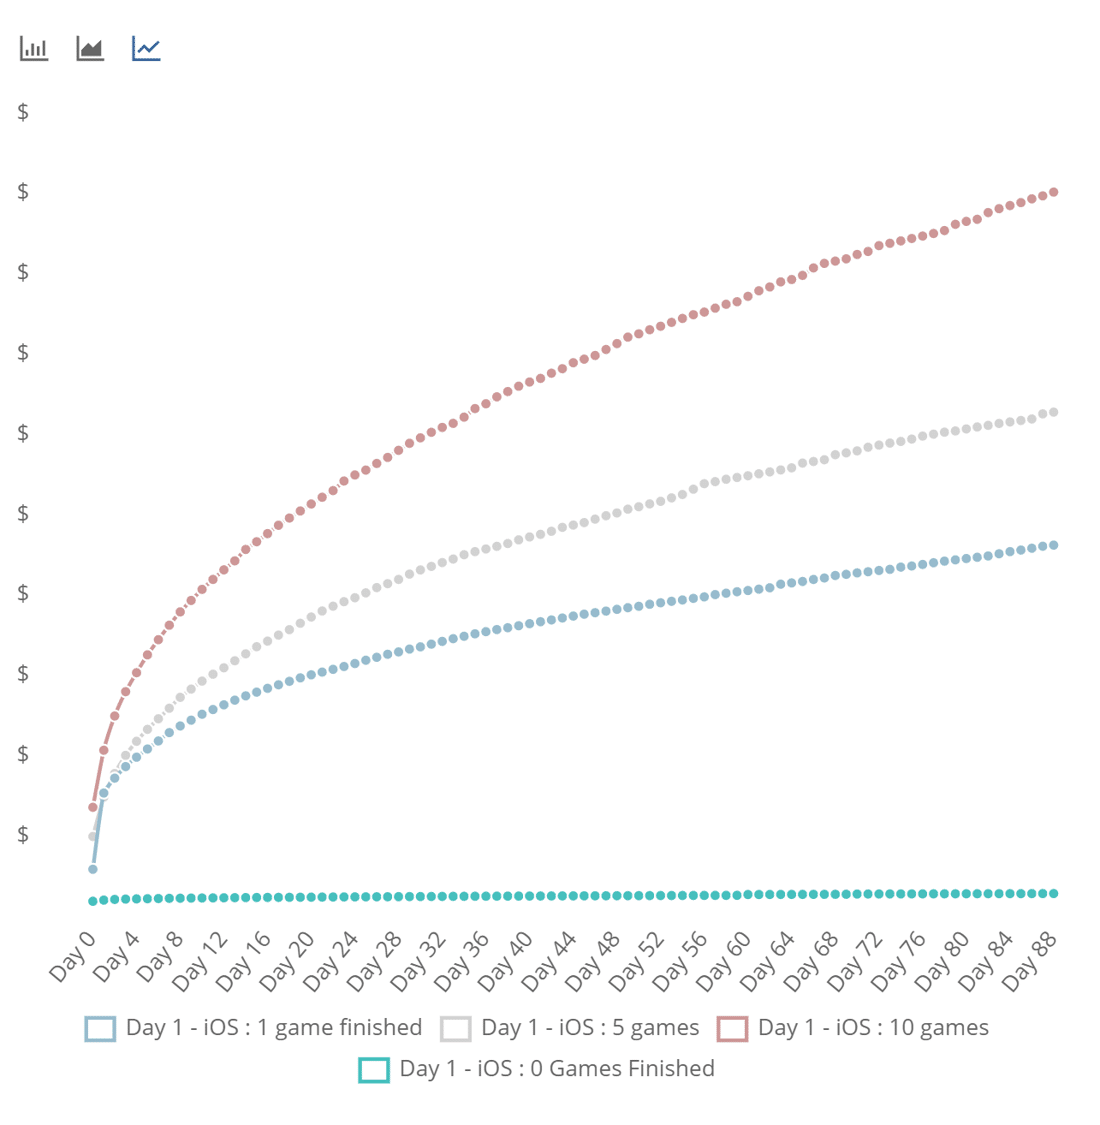
For instance, diving further into the case study on completed puzzle-value, the retention rate is closely tied to the number of puzzles completed.
For Flow Free, if a user fails to complete a puzzle on day 0, they are 4X more likely to churn. Where if a user completes 5 games they are 50% more likely to return on day 1, by completing 10 puzzles they are twice as likely to return.
Events that lead to high-value users:
Your app’s specific use case will help here. By exploring and tweaking the events, or the number of events you can find a suitable number of buckets to help you take action.
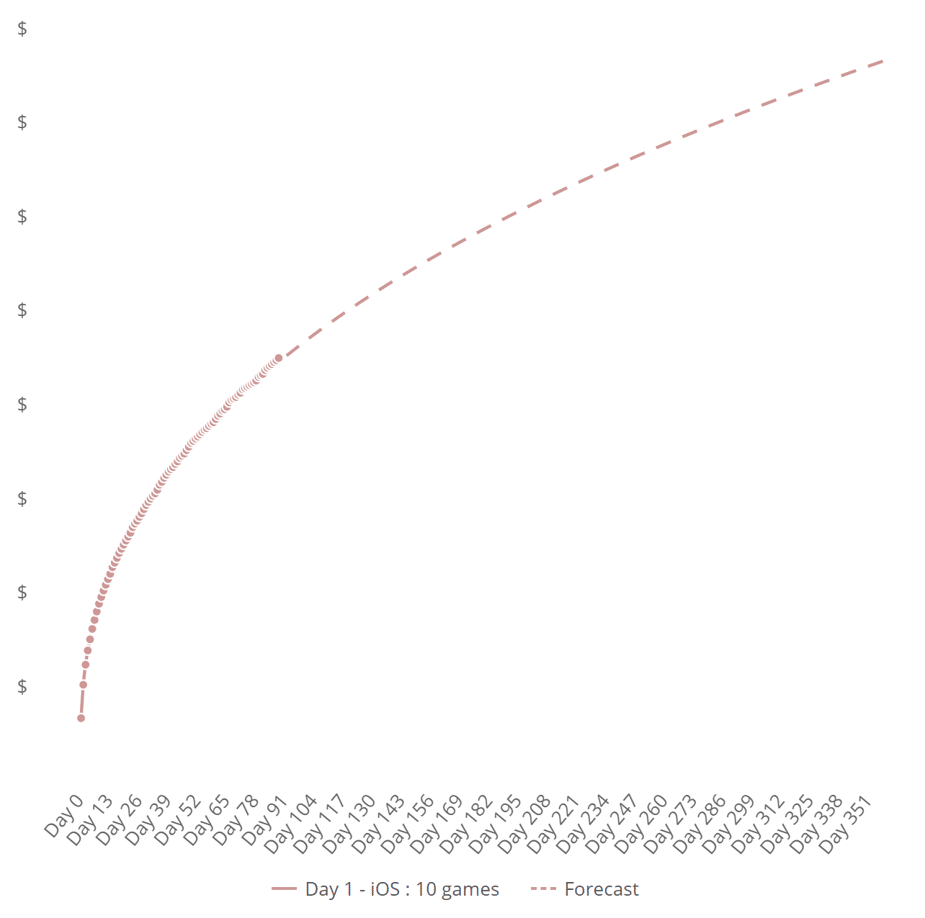
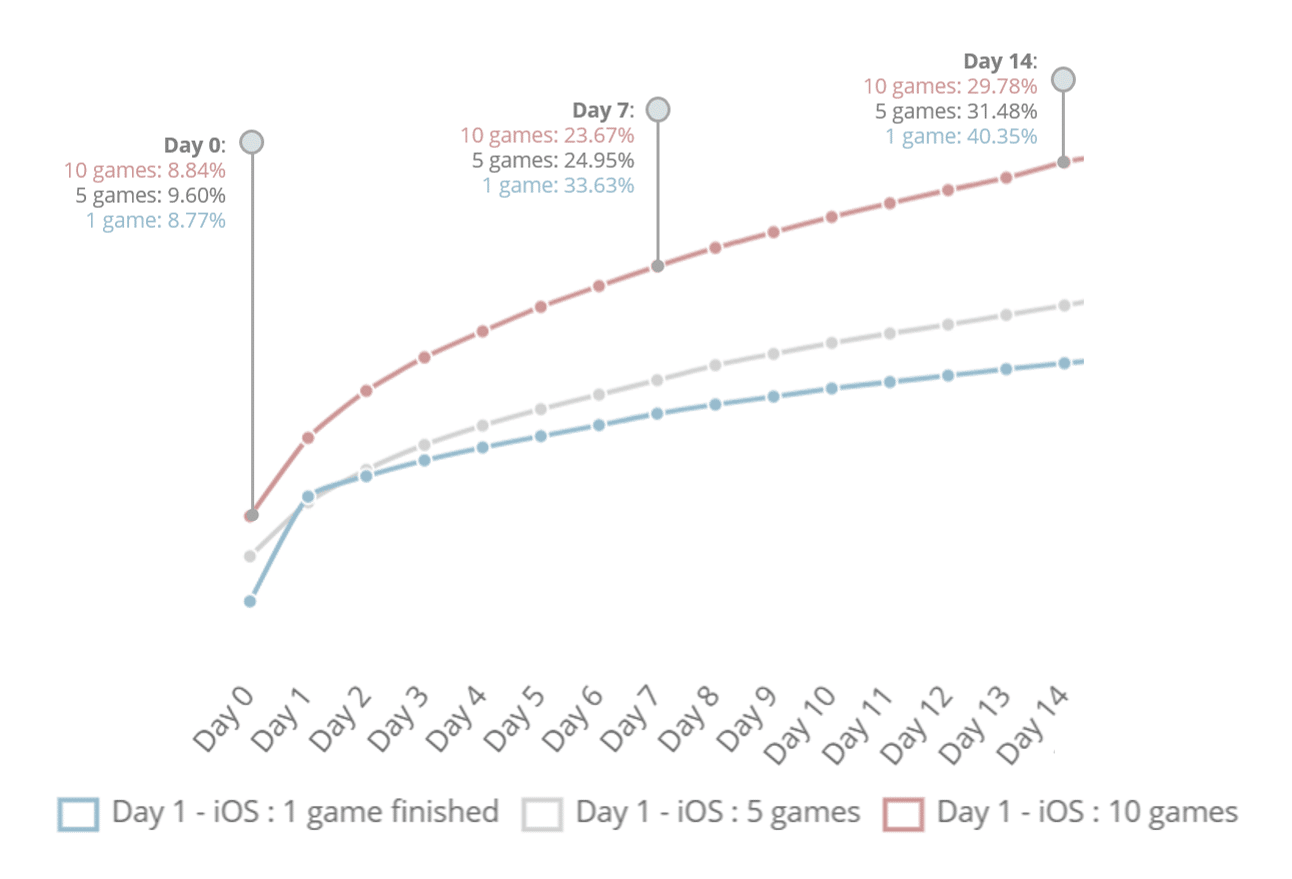
For Flow Free, the number of puzzles completed on day 0 has created 4-buckets of users, each with a different corresponding pLTV at day 365. Users who complete 10 games on day 1 are worth twice that of users who only complete 1 game.
Finding Conversion Events:
This is actually straightforward. Simply model out the actual (or ideally the predicted lifetime) user value (LTV) for users who’ve interacted with the event you’re choosing as a conversion event. Further refinement by country, platform, and campaign will increase granularity – which can help refine results at the expense of statistical significance.
Using the example above, you’ll be able to assign conversion values at the following multiples:
– 1-game: .62X your CPI target
– 5-games .95X your CPI target
– 10-games: 1.41X your CPI target
Note: Correlation does not indicate causation
An app developer I was speaking to recently pointed out “perhaps users are more valuable, not because they tripped this specific ‘high-value’ event, but because they are tripping ‘more events period.’ They’re using the app and have come across this event, that doesn’t necessarily mean every user is more valuable because they tripped this event.”
The truth is, for the purposes discussed in this article, it doesn’t matter: you’re simply finding the correlation of user events to their behavior. So while it’s important to be able to compare these events, to ensure it does measure correlation, it’s not critical to understanding the causation – in this article – that is, to choose the events that caused the outcome.
I will caution a more concrete fear: achieving statistical significance in your measurements. It’s natural that users that last longer in your retention curve will be more valuable users, out of app engagement, increased ad impressions or purchases – don’t let an insubstantial amount of these high-value users dictate your long-term prediction.
So now what?
You’ve found an event, characteristic, or indication of user-churn, low engagement, or some other red flag to user behavior. What are you supposed to do about it? To be blunt: figure out a way to fix it!
You won’t ever keep retention at 100%, you won’t convert everyone into a paying user but you can experiment with changes to influence a portion of the user’s behavior. This can add up and over time can make a substantial impact on your business.
Again, these are probably best served with examples:
Big Duck Games was able to determine the value of a user by measuring the number of puzzles completed on day 1.
Finding ad tracking opt-ins increased user LTVs by 5X, PixelTrend optimized their opt-in prompt, increasing opt-ins 30% and doubling app revenue.
While these ideas may not directly relate to your app, the spirit of their findings does. You need to choose events, create user buckets, measure their performance, then refine and iterate to influence user behavior.
Want to learn more inside tricks we’ve seen? Book some time with us, we’d be happy to give you some examples and advice!
