Top Network Performance for Q2-2019
Top Network Performance for Q2-2019
“Should I be working with anyone else?”
Aggregated network performance ranking is one of the most common requests we receive among our mobile app publishers, especially as we enter the doldrums of Q2 where many take the time to reevaluate and freshen their ad stack. We’ve done our customary look-back on the market over Q1 helping you make the best decisions for your inventory as we enter the second quarter of the year.
Top Fullscreen Networks
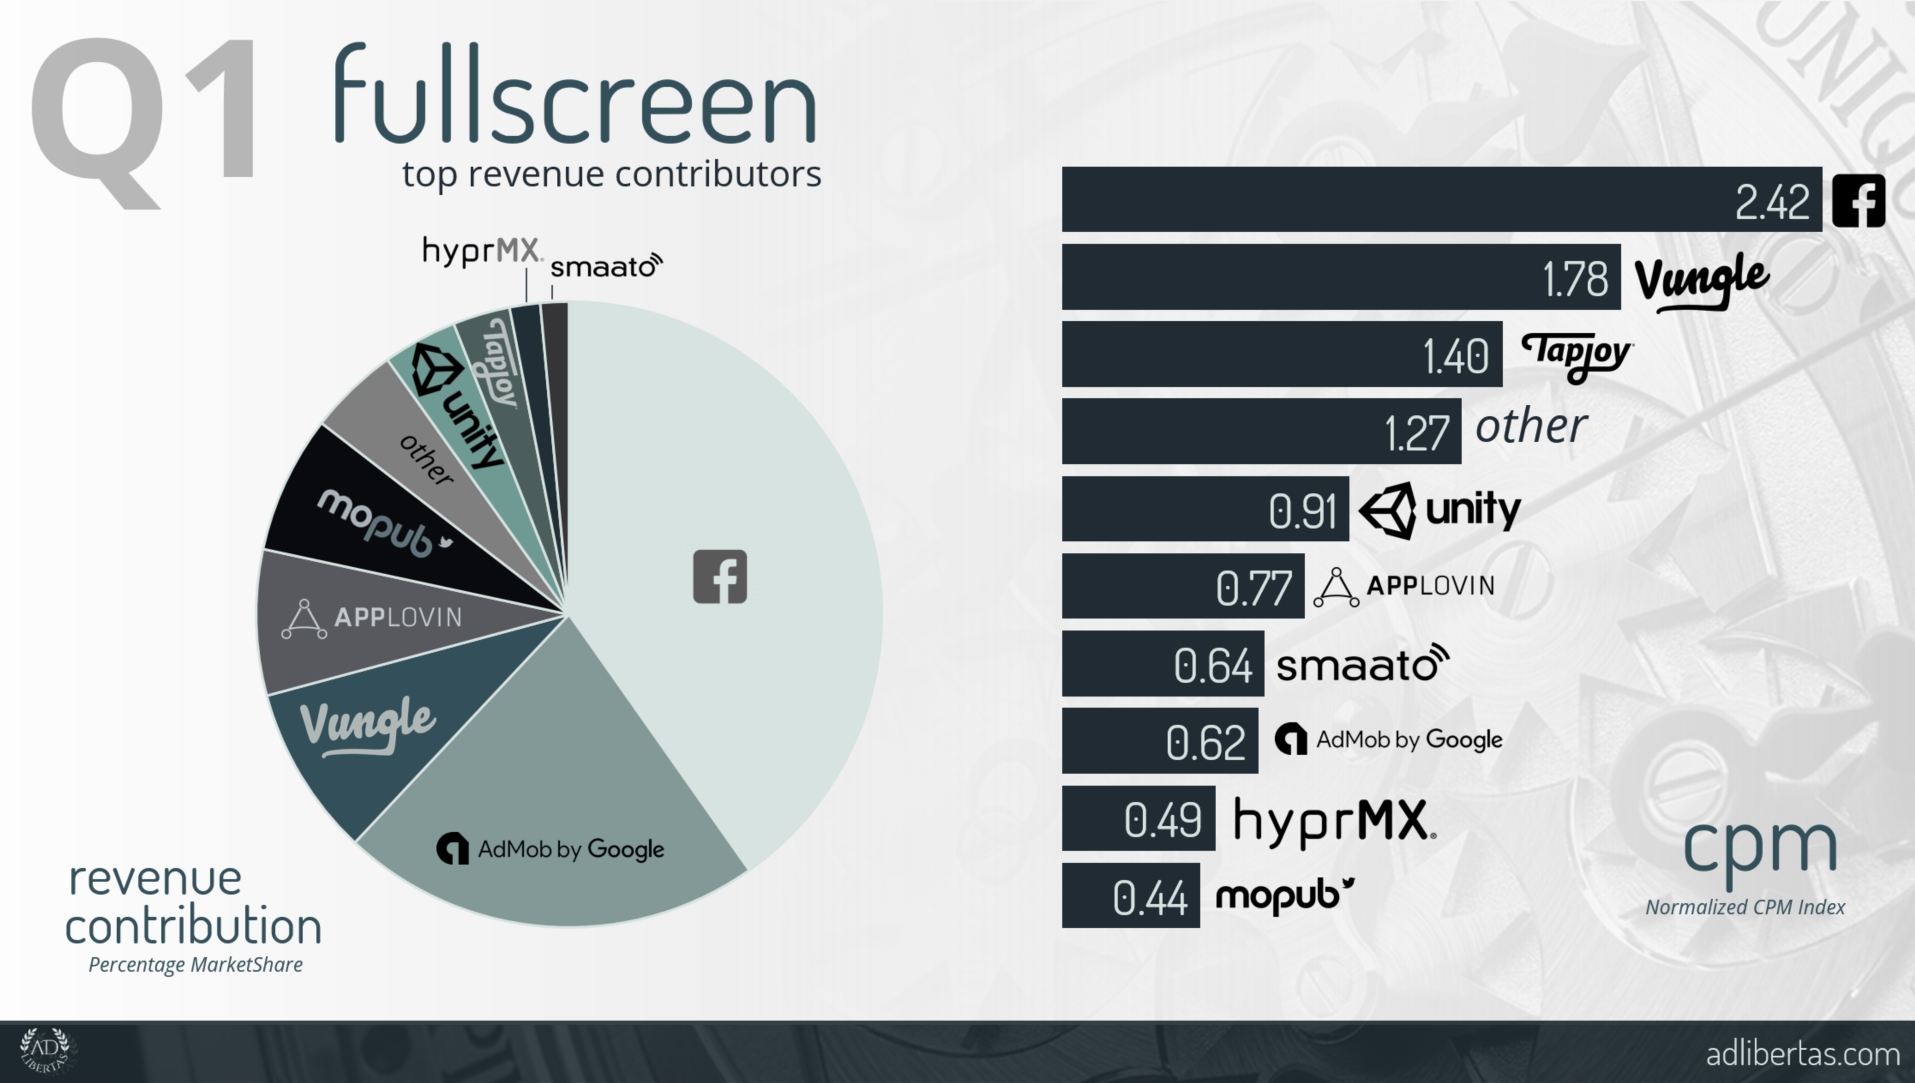
Note CPM is based on a normalized index where the value is a multiple of the entire CPM average.
Notes:
- Our definition of interstitial is MoPub’s ad-type “interstitial” this can include static, dynamic or even video creative served in this ad-size.
- CPM are indexed against the global market average.
- Numbers are based on network-reporting: serving discrepancies are not factored.
- Below ranking is on revenue contribution.
Top Fullscreen Networks – Analysis
Revenue Share vs. Index CPM

Rank Change
1. Facebook took top spot in both global CPM performance and market share, while it’s no mystery Facebook is doing well in the advertising market it is interesting watching them climb the charts.
=
 1
1
2. Admob remains consistent from last quarter’s performance, pulling in a solid #2 in wallet-share and a CPM performance indicating the large volume they consistently bring.
=
1
3. Vungle remains number three in revenue-performance but loses top spot of CPM performance – not a surprise considering Vungle relies on a number of brand campaigns which are notoriously soft in Q1.
=
1
4. Applovin trades Mopub for fourth spot of revenue share and increases indexed CPM – performance networks like Applovin often have strong first-quarters, increasing spend while competition from brands falls off from Q4.
1
2
5. MoPub puts up a very respectable fifth in volume and posts a CPM indicating their strength relies on volume versus premium inventory.
1
=
6. Other – a new category for our index “Other” represents the subset of non-top 10 network contribution. Earning fourth in CPM performance indicates potential strong regional performance from non-listed networks.
new
new
7. Unity falls to “average” CPM performance – down from their Q4 posting but only falling one spot in revenue contribution.
1
2
8. TapJoy jumps in CPM performance for Q1 posting a solid third position indicating they can hold their own with high-quality banner inventory.
1
2
9. HyprMX – a largely brand-focused network – understandably falls in CPM during Q1 but still makes the top ten of revenue contributors beating out some of the other better-known networks.
1
5
10. Smaato remains in the top 10 and climbs in CPM performance from their Q4 showing.
1
2

Top Banner Networks
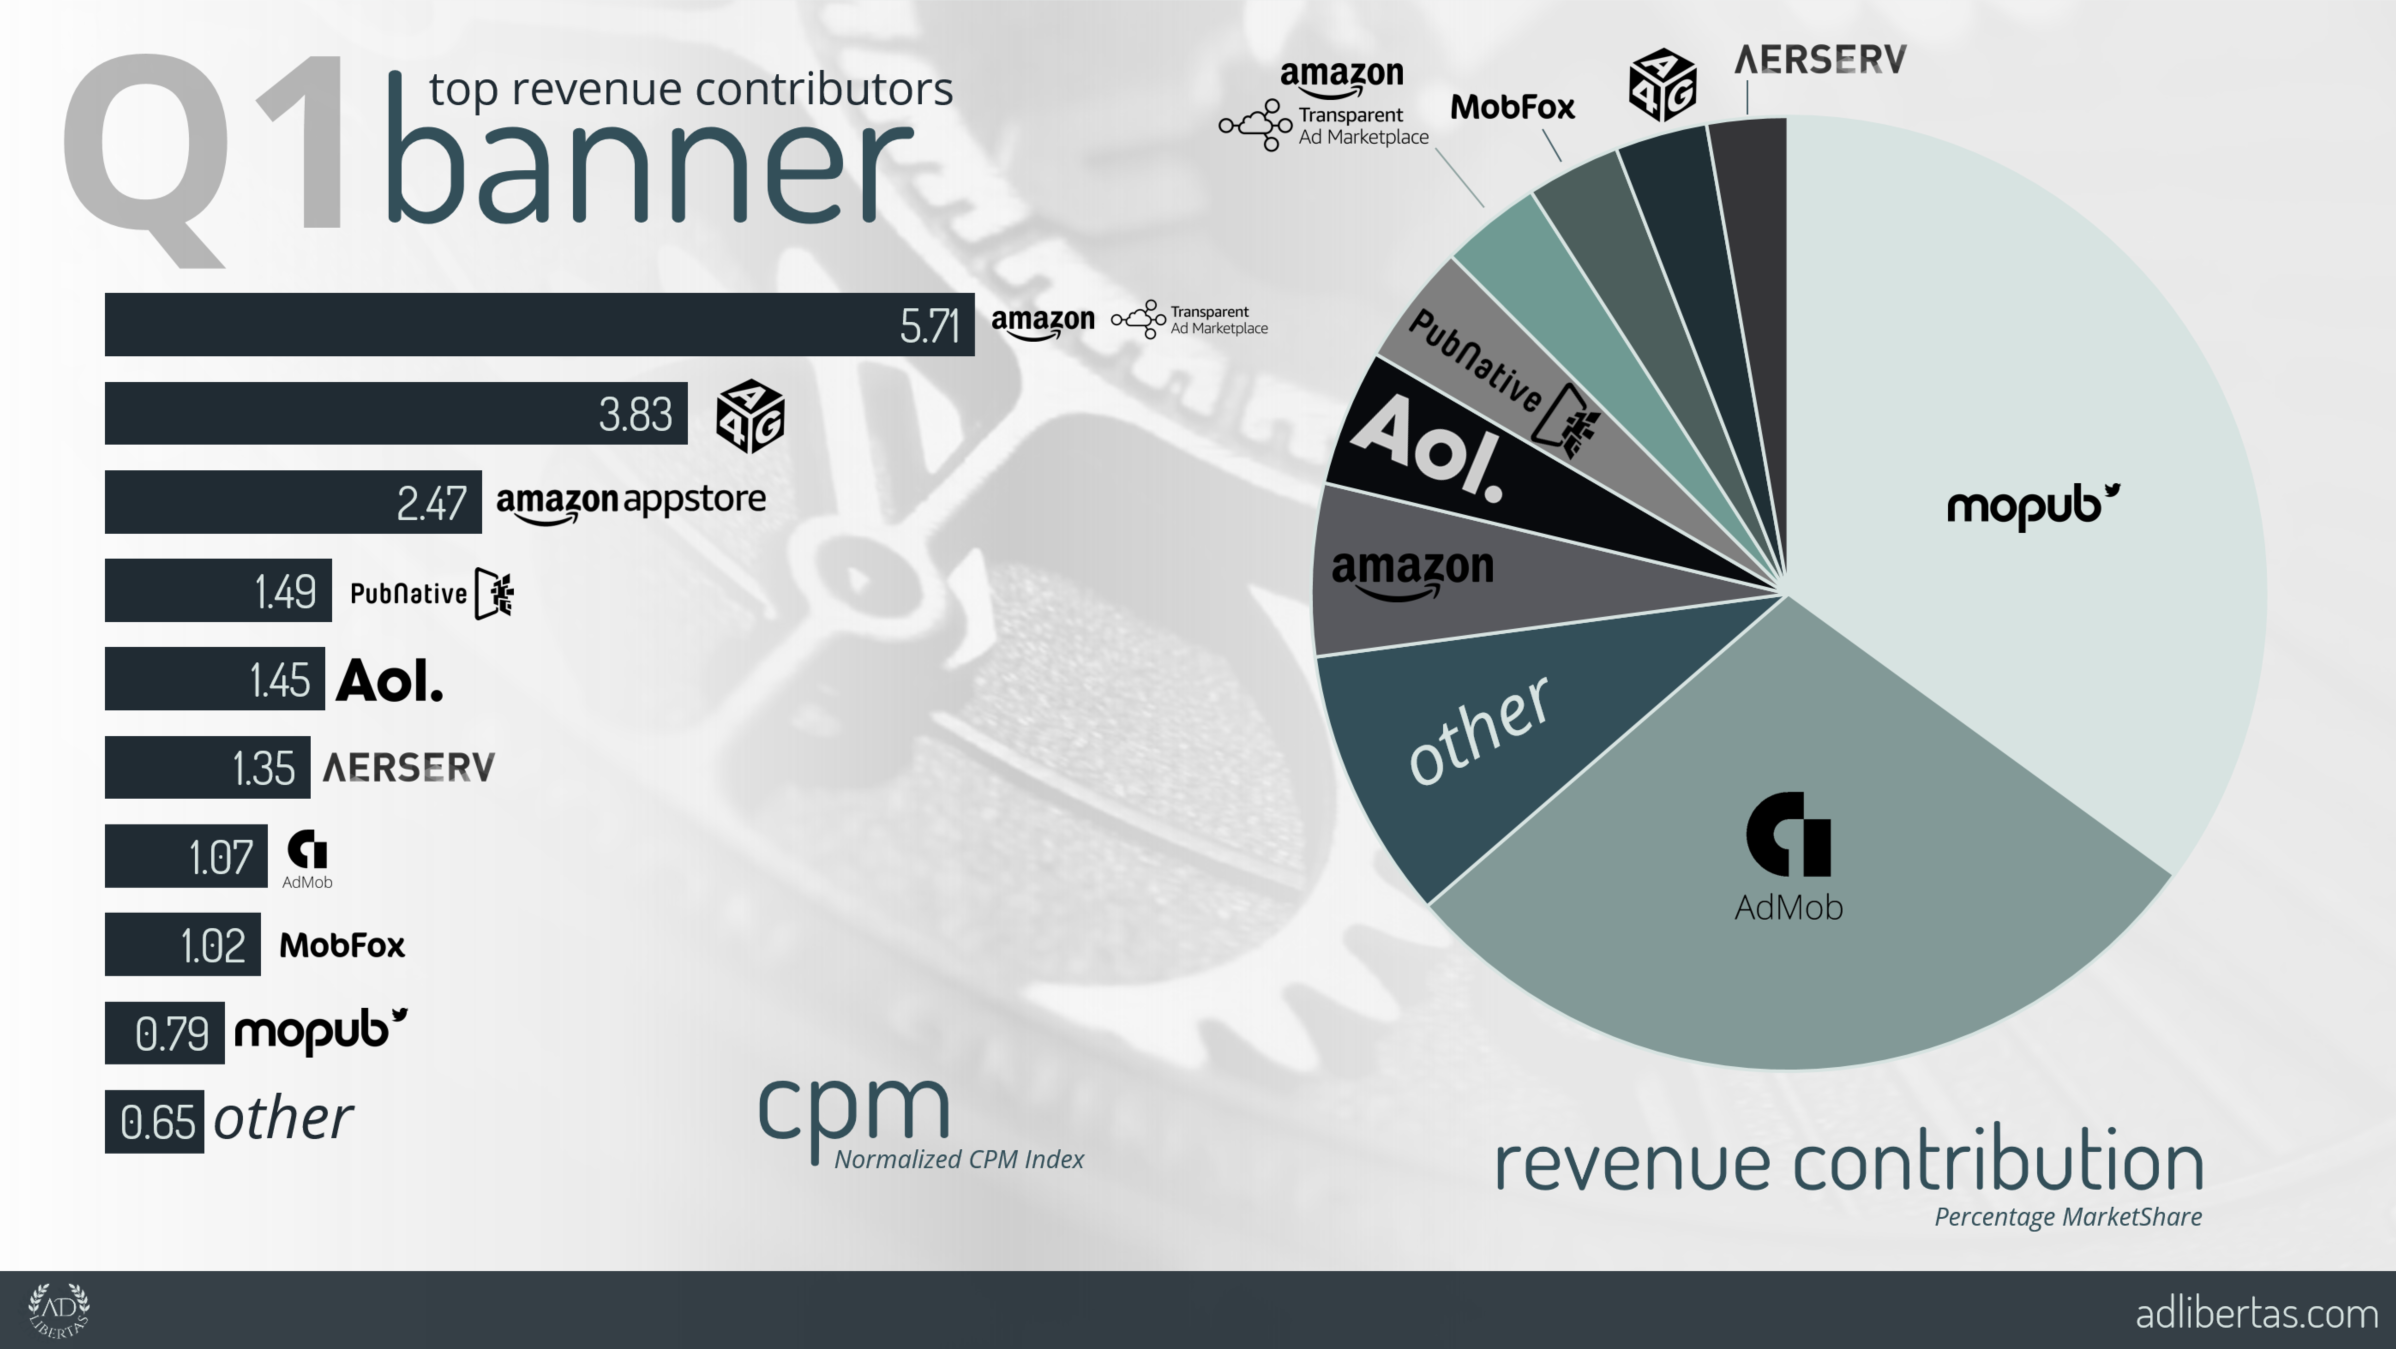
Note CPM is based on a normalized index where the value is a multiple of the entire CPM average.
Notes:
- Our definition of banner is MoPub’s ad-type “banner.”
- CPM are indexed against the global market average.
- Numbers are based on network-reporting: serving discrepancies are not factored.
- Below ranking is by revenue contribution.
Top Banner Networks – Analysis
Revenue Share vs. Index CPM
Rank Change
1. MoPub continues to show dominance by remaining in top-volume spot — even growing market share from Q4 — making them a necessity for anyone moving large banner volume.
=
1
2. Admob moves up substantially from Q4’s posting and wrestles the number two spot in volume away from AOL.
=
4
3. Other networks – surprisingly non top 10 networks make up the third-highest world-wide revenue contribution but by taking the lowest CPM show indication non-US traffic still presents a fragmented market, requiring the exploration of ancillary players.
new
new
4. Amazon grows their revenue share from Q4 and puts up a very respectable third-highest CPM.
2
1
5. AOL grew CPM performance drastically at the expense of revenue contribution (falling from third to fifth) in revenue volume.
3
4
6. Pubnative grew in volume, up from near-bottom in Q4 while maintaining a CPM index of 50% above average.
4
2
7. Amazon Header Bidding continues to command interest at the 5X global CPM average but it should be noted buying primarily happens in English-speaking countries and low volume is largely indicative of the few players who have undertaken the complicated integration process.
2
=
8. Mobfox — a name from the past — jumps into the top 10 list with a spot-on-average CPM.
new
new
9. A4G – a new player to our top-ten players commands immediate interest posting the second highest CPM among our world-wide players
new
new
10. Aerserv (not including Inmobi revenue) wrestles the final spot in our revenue-share ranking and posts a slightly better than average CPM.
new
new
Top Networks by Geo
The concentration– and performance– of app traffic can skew by geography by publisher, app and even platform. We’ve broken down top-network performance by the top 3 segments of most publisher earnings. Ranking is listed by volume, CPMs are given in a normalized index.
Note networks are ranked by revenue contribution and the CPM is based on a normalized index where the value is a multiple of the entire region’s CPM average.
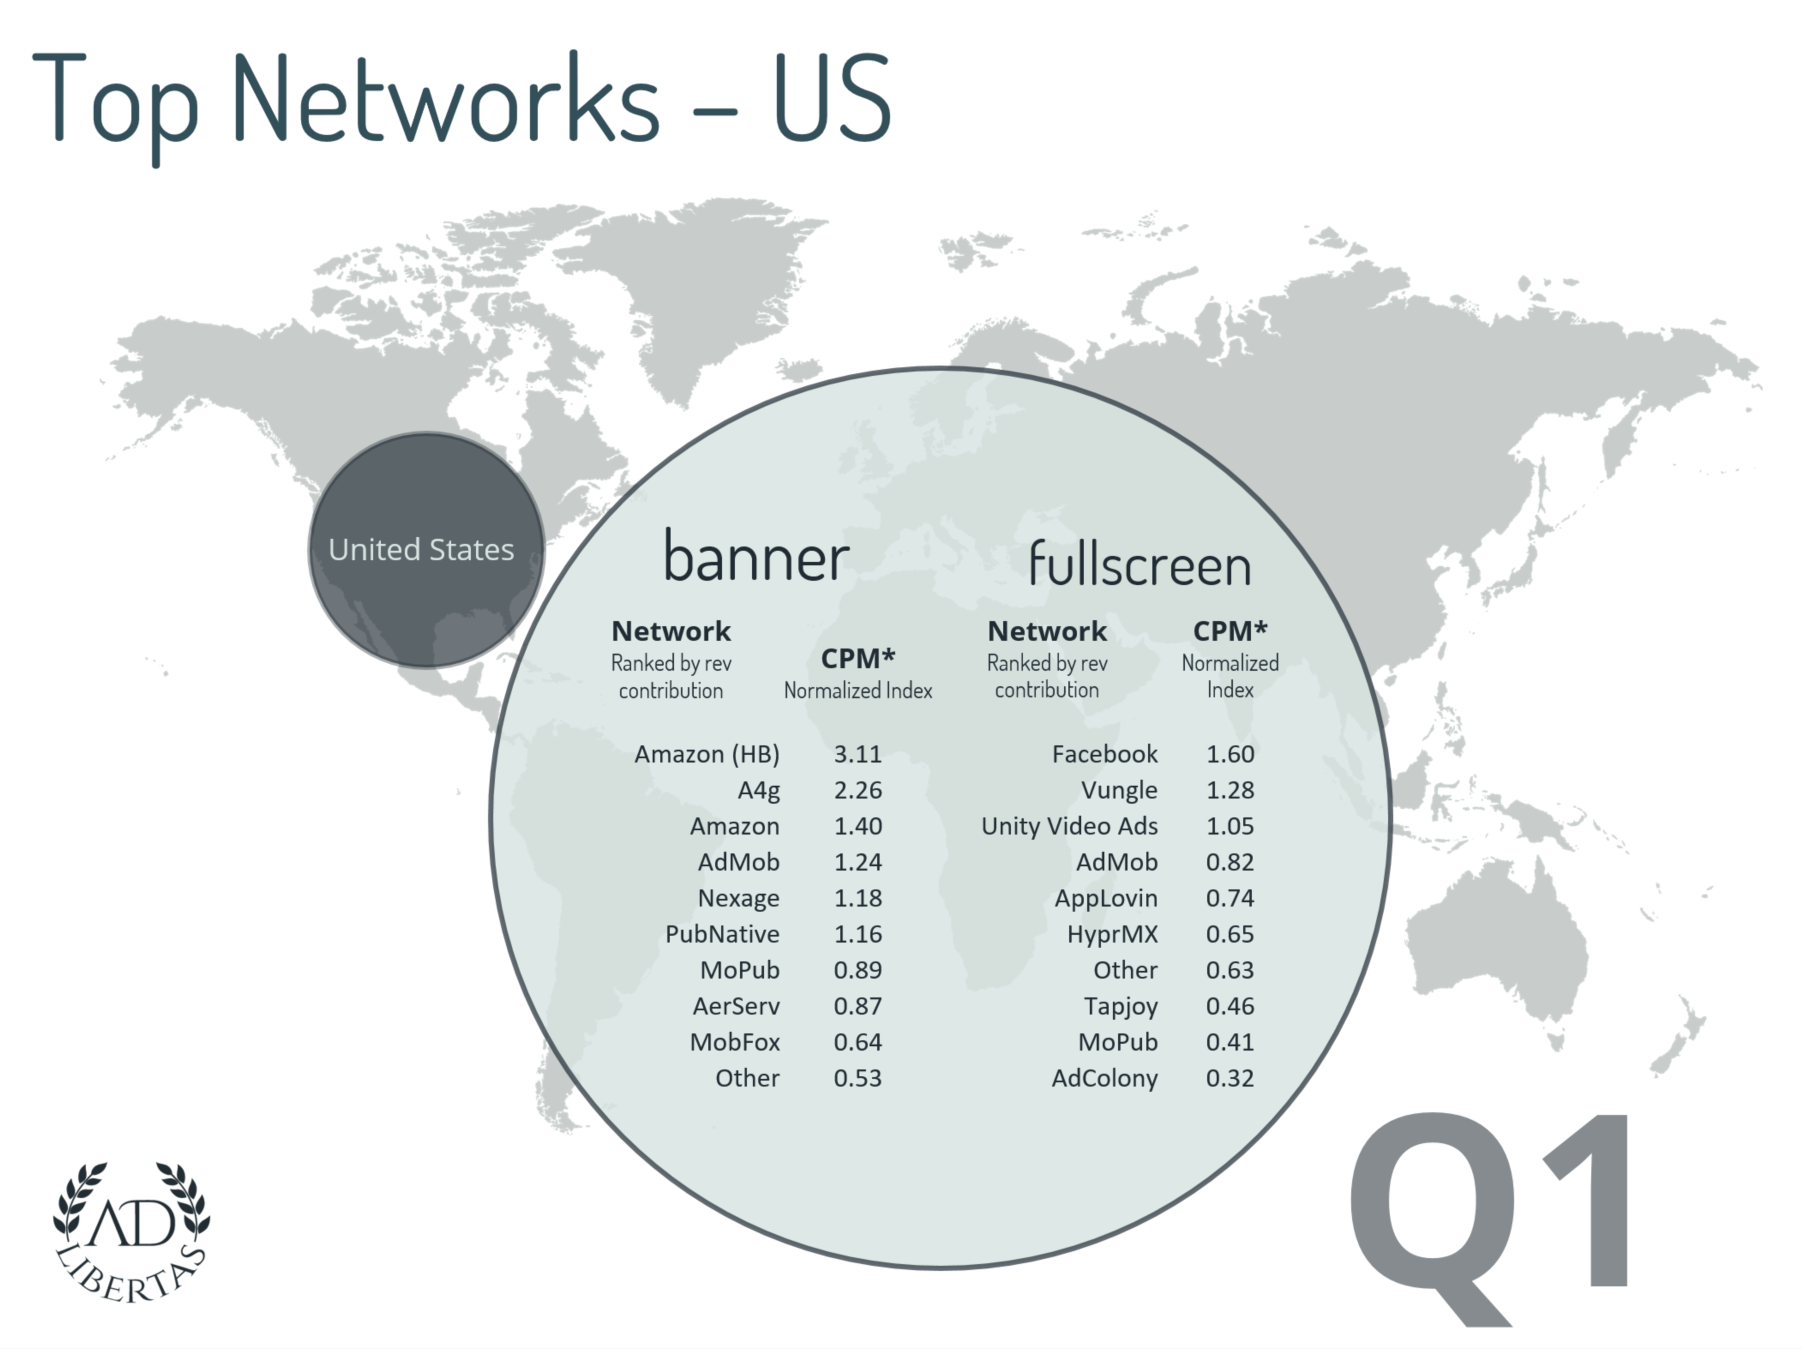
Click image for larger resolution.
For most publishers the US represents the largest single segment of inventory earnings.
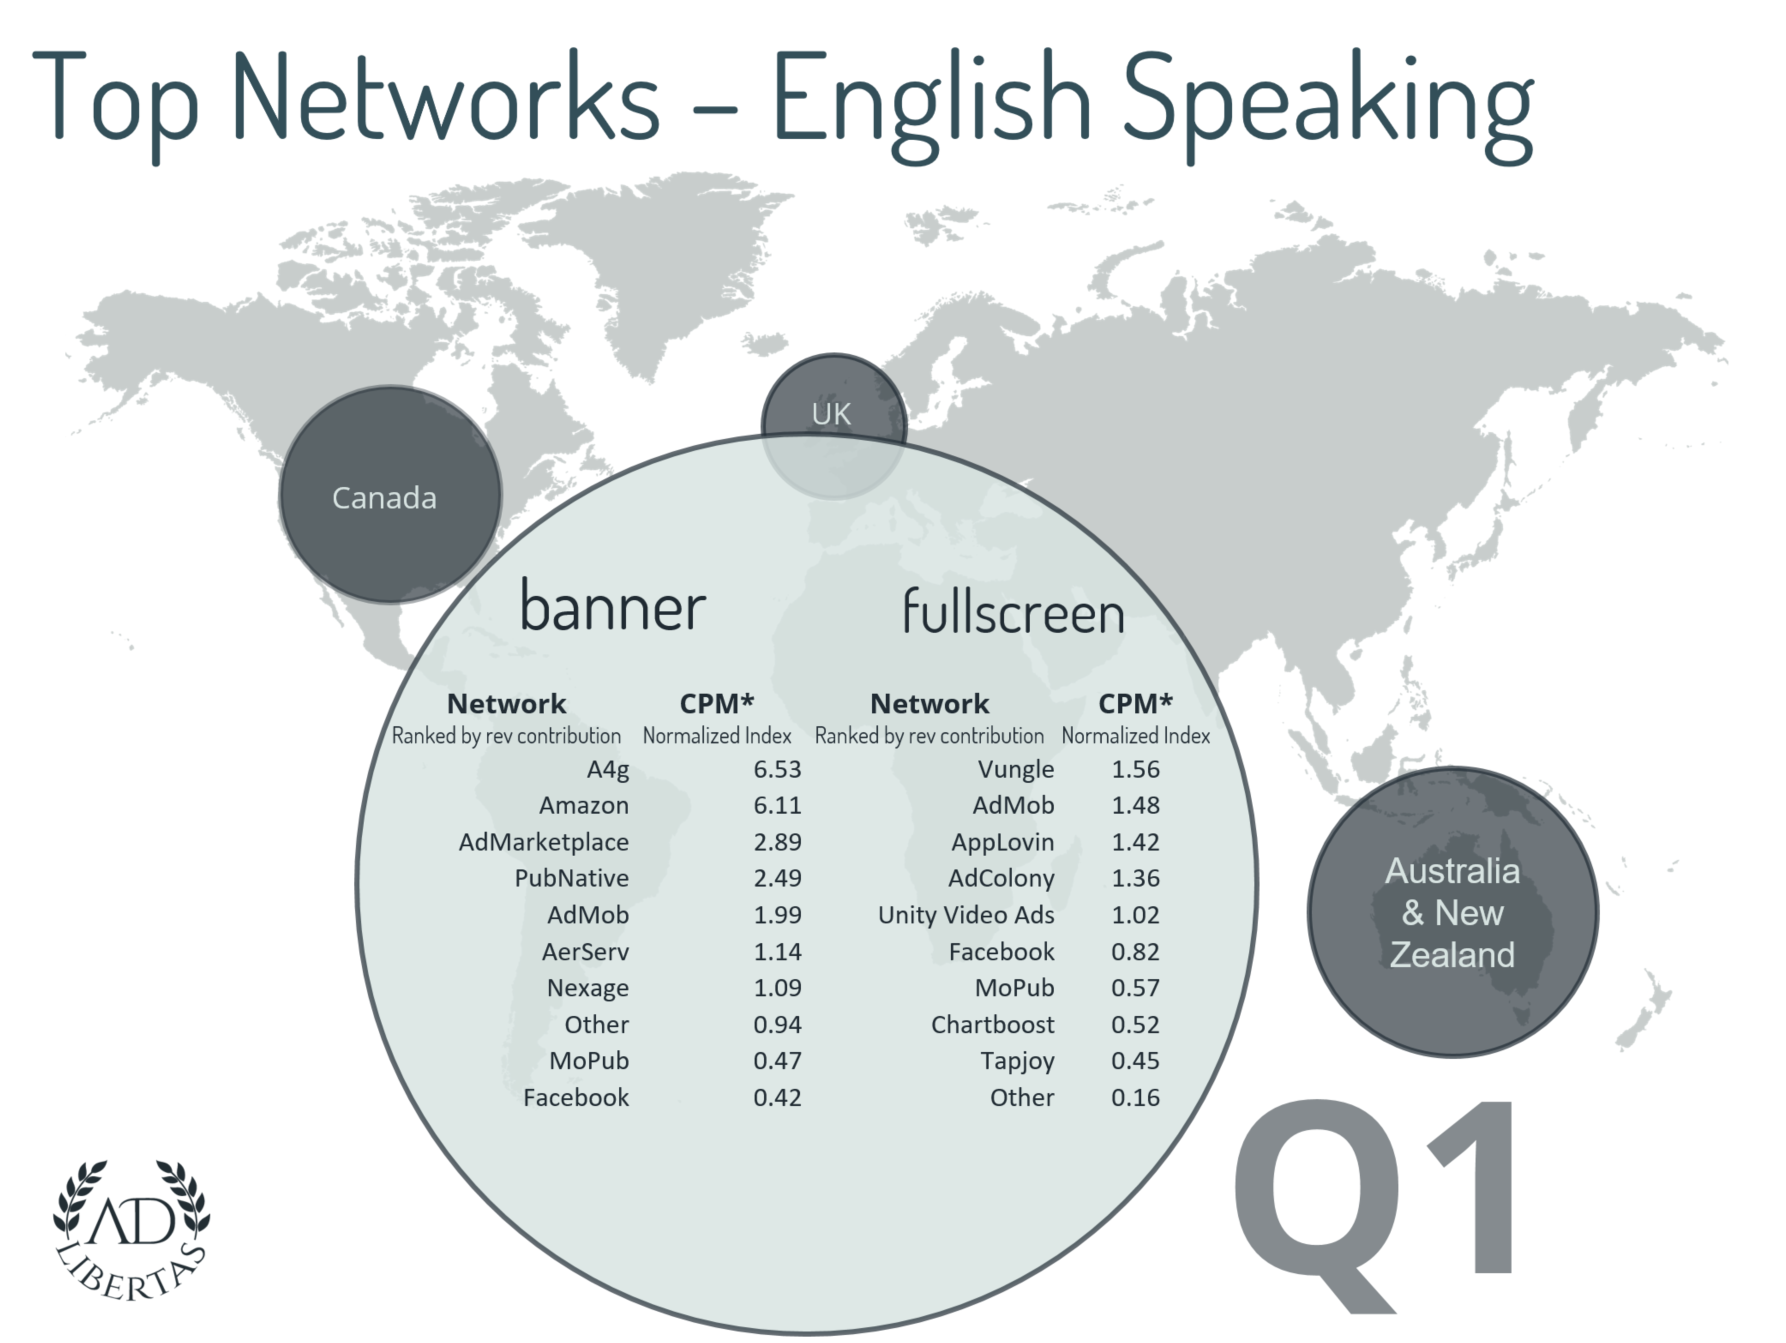
Click image for higher resolution.
English Speaking is defined as Canada, United Kingdom, Australia and New Zealand and often represents the second-largest segment of publisher earnings.
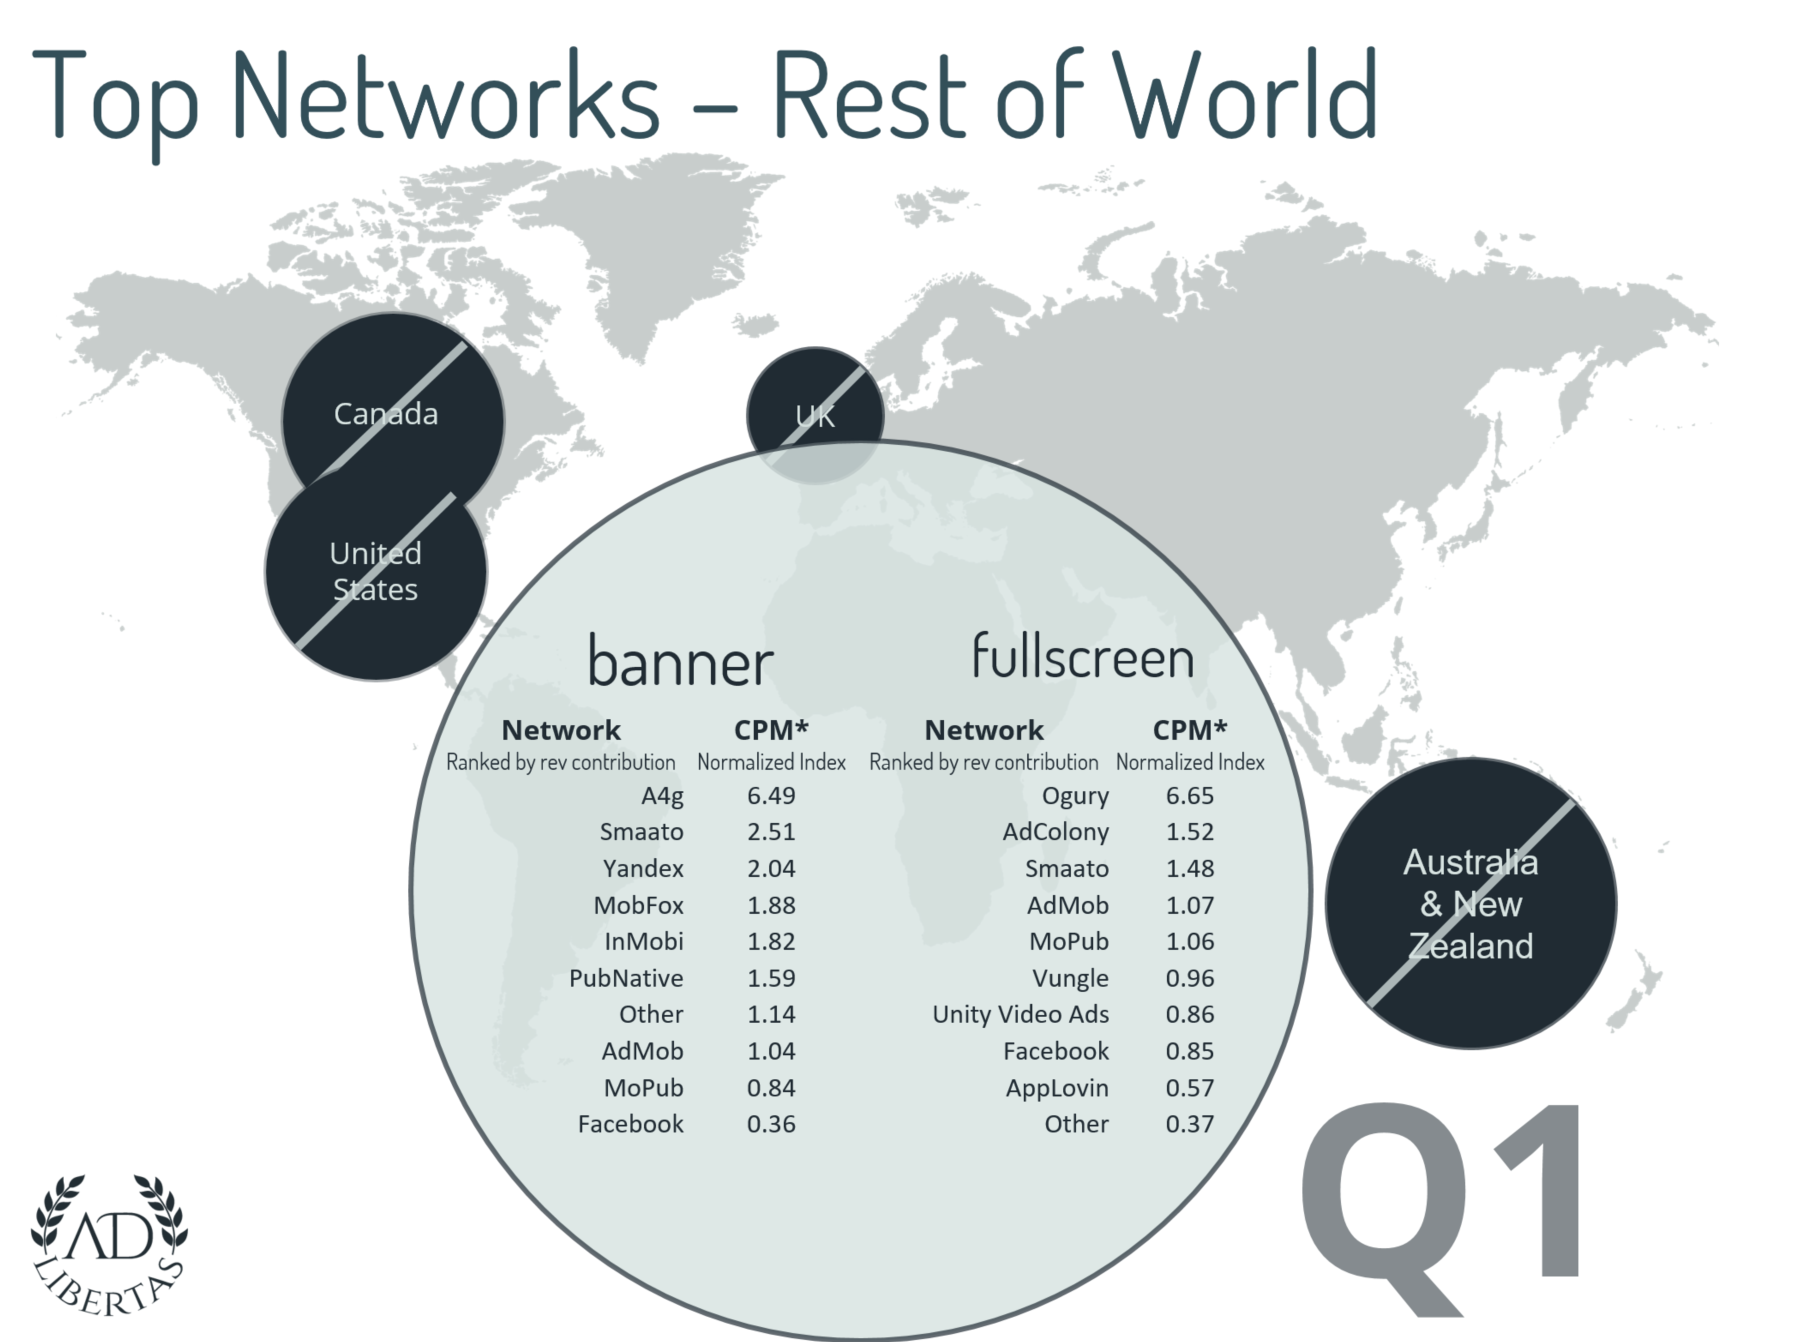
Click image for higher resolution.
In this definition Rest of World represents all countries except US, UK, AU, CA & NZ. While this doesn’t mean publishers treat these countries similarly for optimization, often higher performing networks in these regions will perform similarly in many regions.