Top Network Performance – 2019
Top Network Performance – 2019
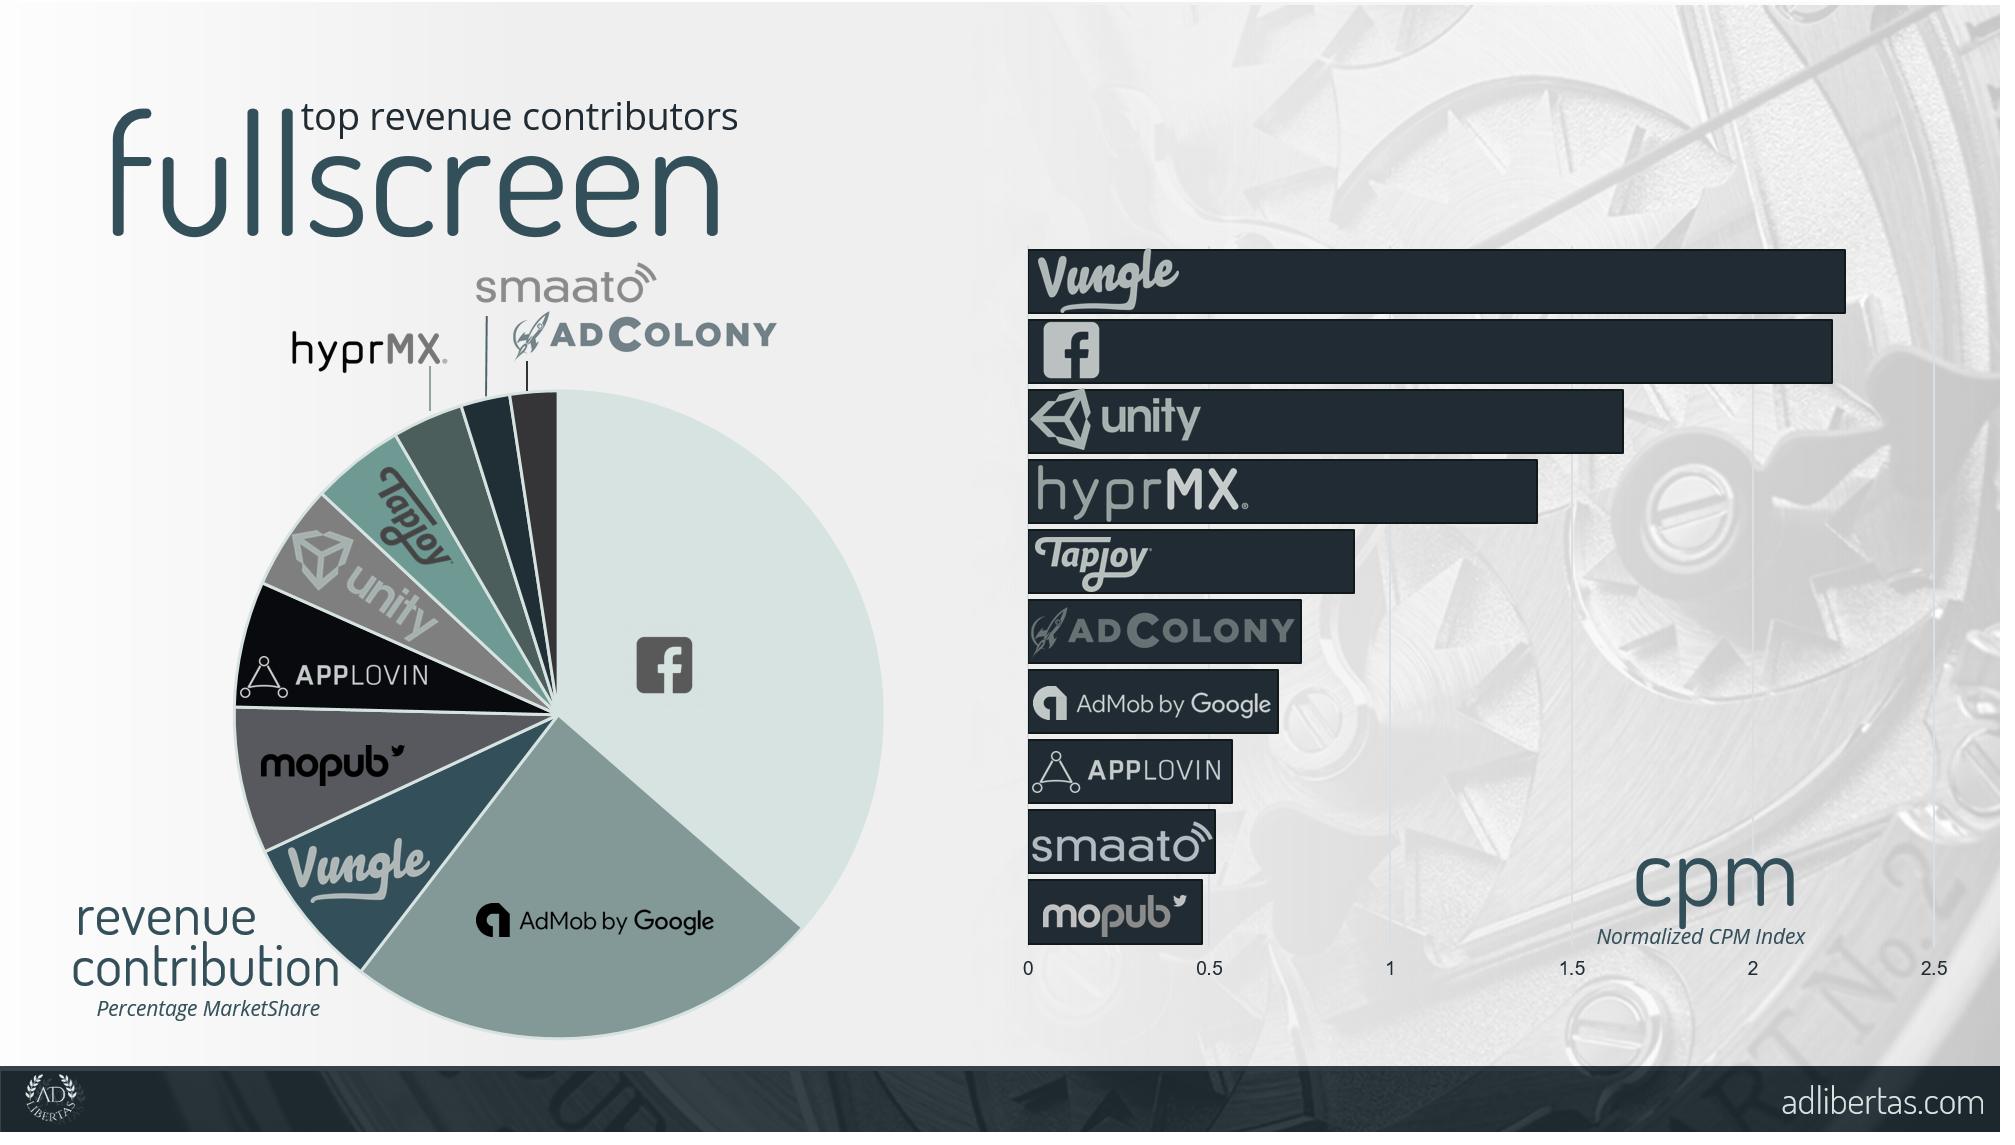
Another Q4 has come and gone and while we are suffering the after-effects of sky-high year-end performance, many turn to the ad-stack in the interest of rounding out demand partners, trimming the fat and adding newcomers. Back by popular demand, we’ve complied top network performance over Q4 — there are some new additions, plenty of the usual suspects and some surprising entries.
Note CPM is based on a normalized index where the value is a multiple of the entire CPM average.
Top Fullscreen Networks – Analysis
- Facebook may be a close second in CPM performance but it more than makes up in volume. We’ve found it’s not a strong performer for all inventory but where they perform, they shine.
- AdMob continues to provide stable CPMs & fill. A must for world-wide inventory. They often compete for top priority buys and virtually always provide fill to countries where others struggle.
- Vungle made an impressive bound to become a top-tier buyer in Q4. Their video inventory gives impressive fill and high-CPMs and launched them into a high-performance category. To be sure, a welcome addition to the fold.
- MoPub — like Admob– provides high-volume buys and decent CPM, we’ve found they function well as a top-3 volume contributor outside of the US. Certainly a welcome buyer for the many monetizing world-wide traffic
- As a top-five volume contributor AppLovin certainly can’t be ignored – with strong performance-focused inventory plenty of publishers find their floors a good way to add competition to their stack.
- Another newcomer, Unity is certainly worth review. A favorite of game-install friendly inventory, their buys are consistent and definitely help fill out the top-tier ad buys.
- One of the first performance buyers in the market, TapJoy continues to perform in the top 10 — both in the US and abroad. It’s no surprise why they remain a solid buyer for many.
- A newcomer to the market HyperMX brings the much-fabled brand dollars to mobile apps. While brand-buys bring their own challenges of performance consistency they are certainly welcome additions.
- Another member of the old-guard but a newcomer to the top 10 for interstitial is Smaato. If you have lots of non-English speaking interstitial volume, Smaato might be a good fit for you.
- AdColony continues to perform for some publishers — showing above-average CPMs in English-speaking countries and top 10 in RoW regions.
Notes:
- Our definition of interstitial is MoPub’s ad-type “interstitial” this can include static, dynamic or even video served in this ad-size.
- CPM are indexed against the global market average.
- Numbers are based on network-reporting: serving discrepancies are not factored.
Top Banner Networks – Analysis
- MoPub may give average CPMs, but they do it consistently, around the world at incredible scale. They remain a veritable force in banner buying volume. It’s no wonder so many publishers rely on them as a powerful force in their buying arsenal.
- AOL (aka Nexage, Oath, and most recently Verizon Media) is another strong contender, top 3 in volume world-wide and consistently strong CPM in the US. Their flexible buying strategies (JS Tag, SDK, Header Bidding) give a few integration options for a quick integration. We may be calling them by another name but surely they’ll stay atop our list throughout 2019.
- Admob’s average CPM may not be at the top of the list, but don’t let that fool you: they’re hurt by their appetite for volume that keeps them in the top 3, CPMs for US-speaking countries remains high for many partners.
- Fyber (aka Inneractive) keeps last year’s high CPM & volume performance. Their recent offering Fyber VAMP promises strong focus on video inventory but their place as a top banner producer in the US makes them a strong-case for consideration.
- Smaato provided some surprisingly high CPMs & volume in the US and Rest of World regions, certainly not to be counted out.
- The Amazon AppStore (aka Amazon Mobile Ad Network) continues to drive impressive CPM & volume for many publishers. Since they are heavy in retail-focus, they buy very targeted regions and perform exceptional during the Q4 time-period, spiking during black Friday but carrying momentum through the end of Q4. Their highs, unfortunately, mirror their lows, as demand runs very short in Q1, making it good augmentation but not single-source-solution.
- InMobi makes the list with above average CPMs and top-10 volume. Traditionally publishers look to them for RoW coverage but they shouldn’t be ignored for high CPM English-speaking regions.
- Amazon Transparent Ad Marketplace (aka Amazon Header Bidding) shares a similar demand profile to the Amazon Mobile Ad Network but differs in a more sophisticated integration. This comes with benefits, the highly targeted buys may not bring high buy volume but the CPM running at 5X the average makes them an important buyer for many publishers.
- Pubnative’s flexible buying options (tag, sdk, & header bidding) make them a versatile addition, their above-average CPMs are strong world-wide, and while they may not be a high-volume buyer, they are usually a welcome addition to most waterfalls.
Notes:
- Our definition of banner is MoPub’s ad-type “banner.”
- CPM are indexed against the global market average.
- Numbers are based on network-reporting: serving discrepancies are not factored.
Top Networks by Geo
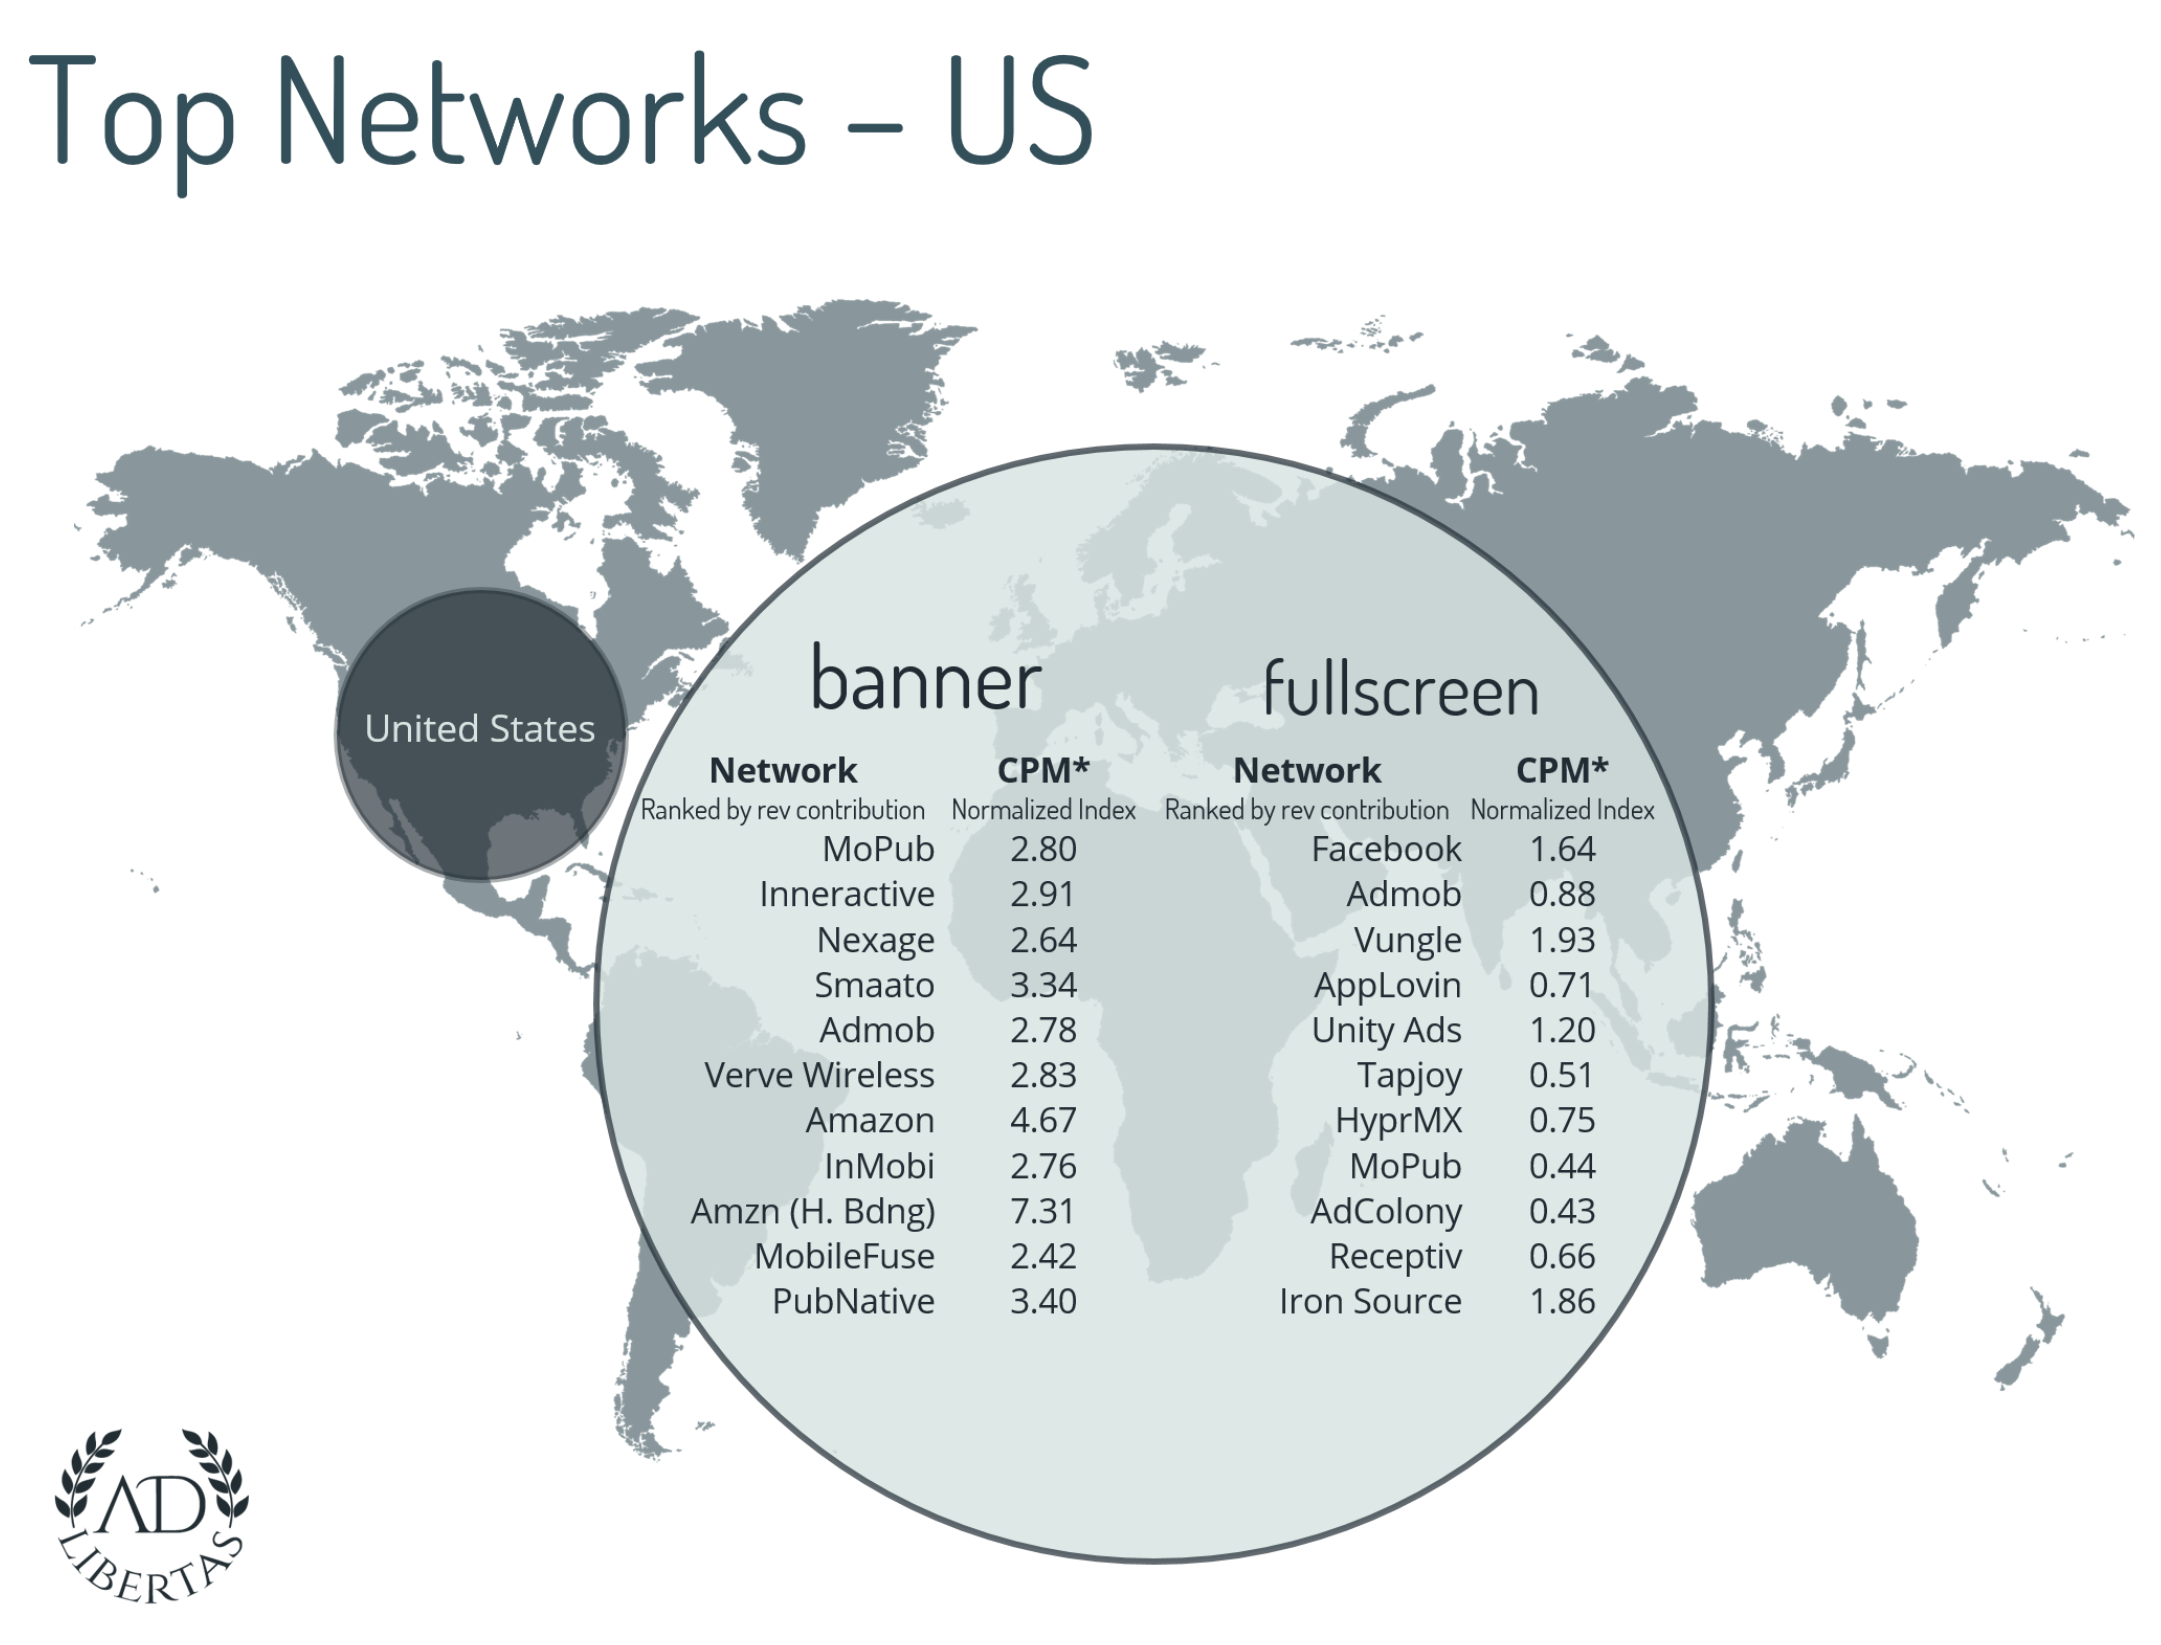
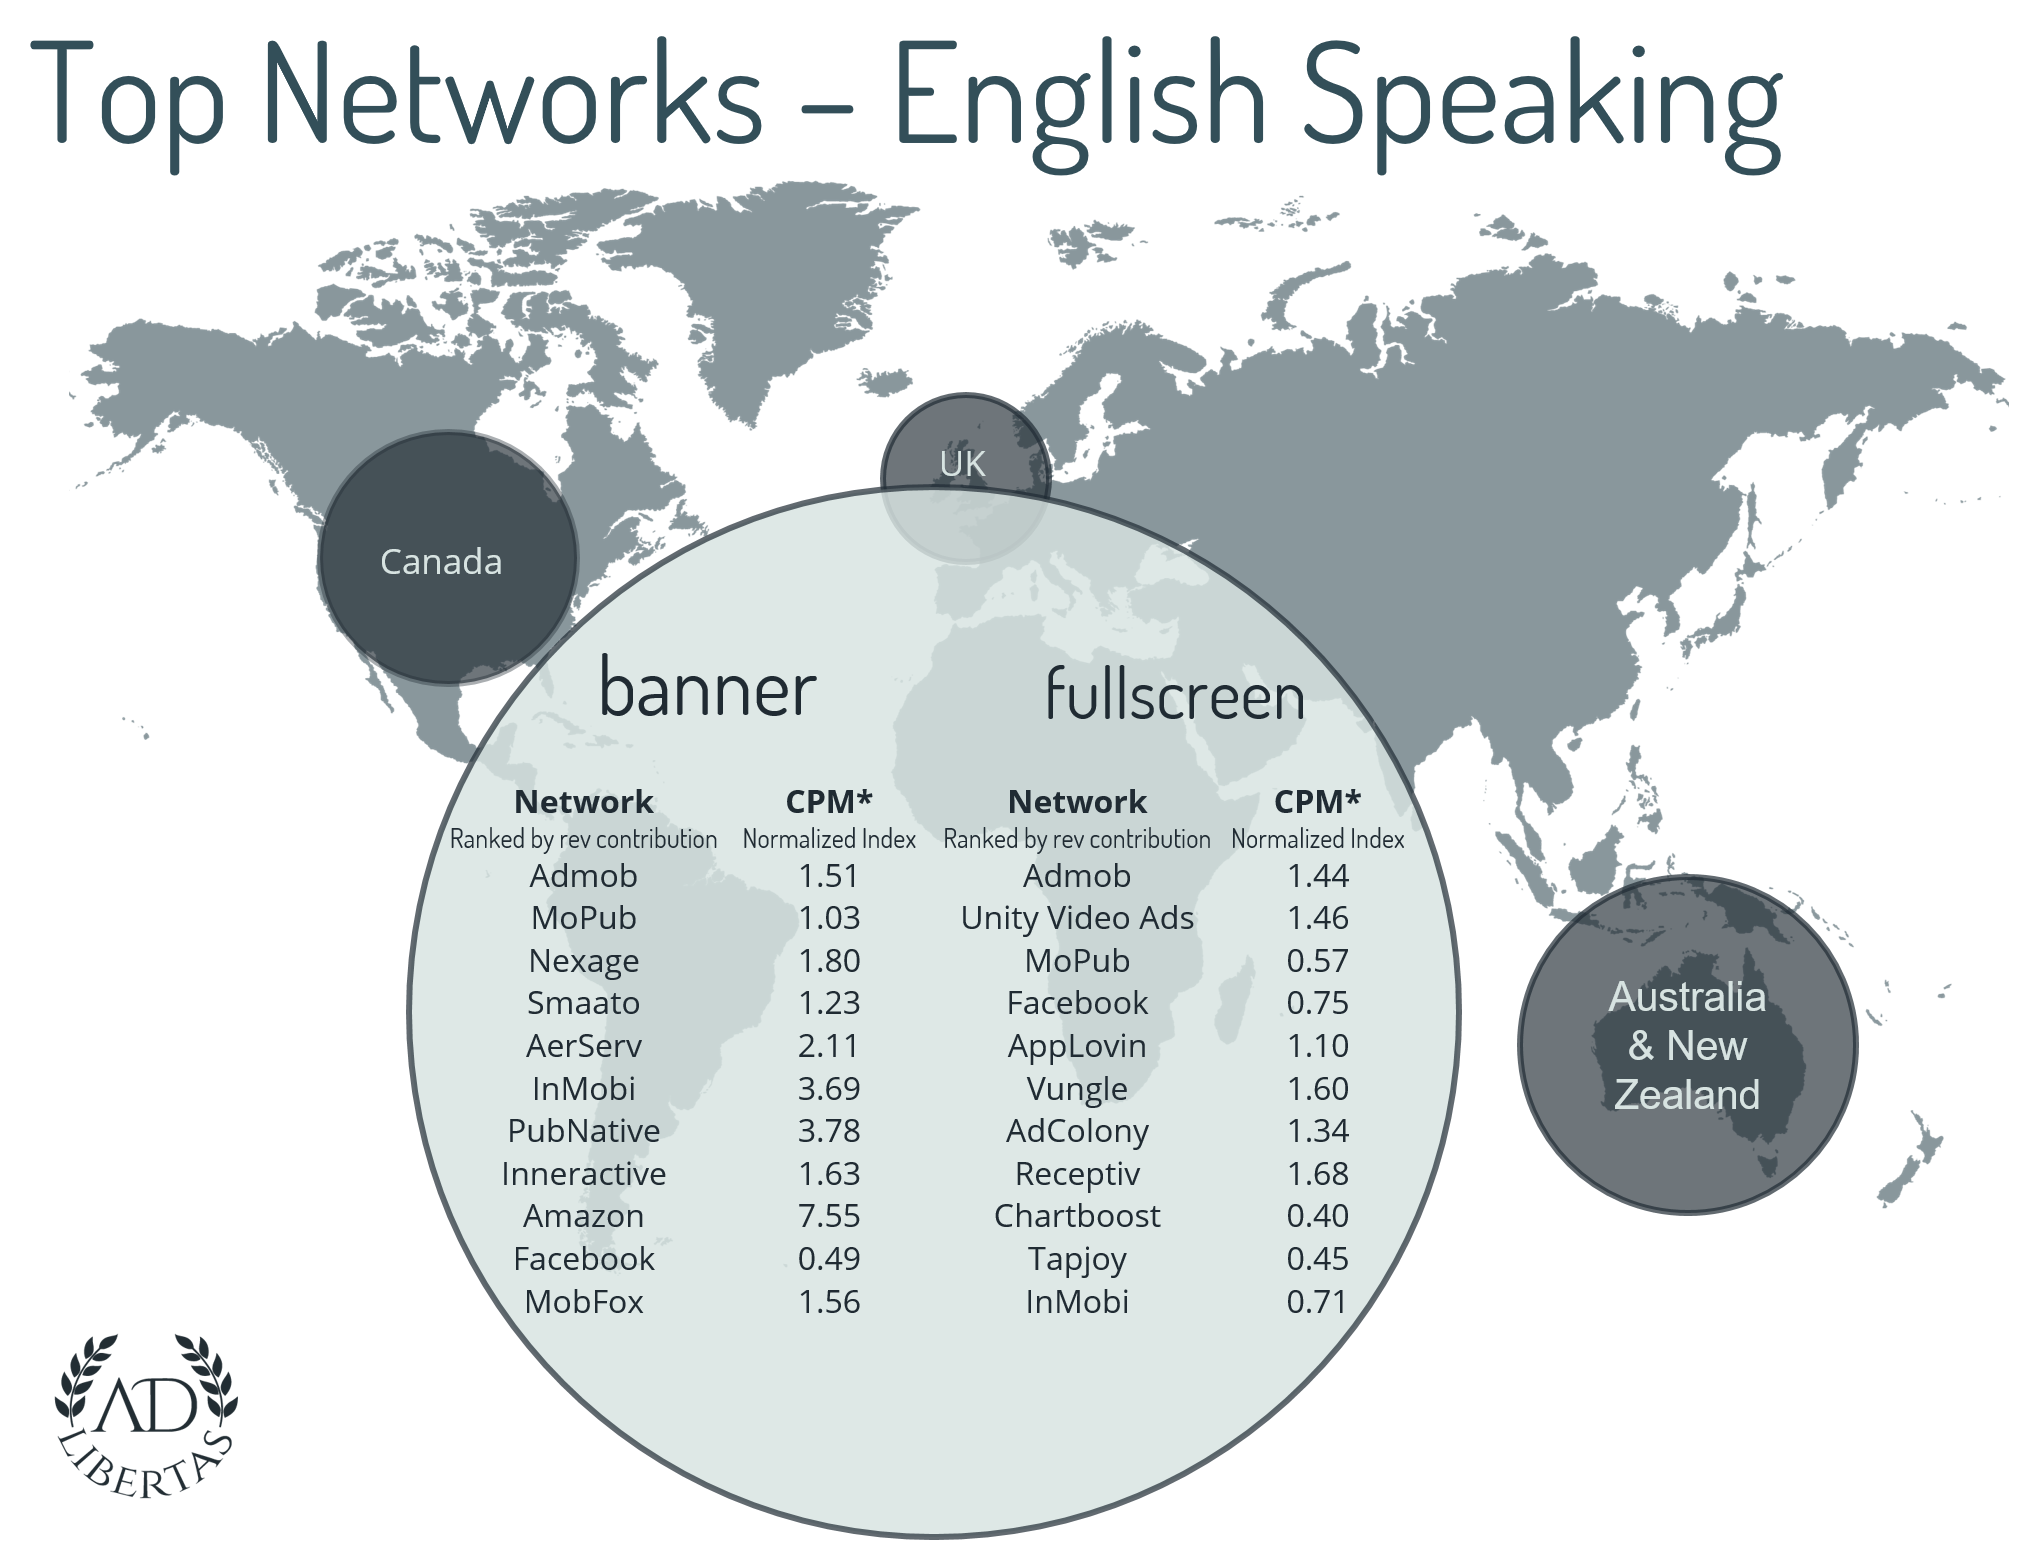
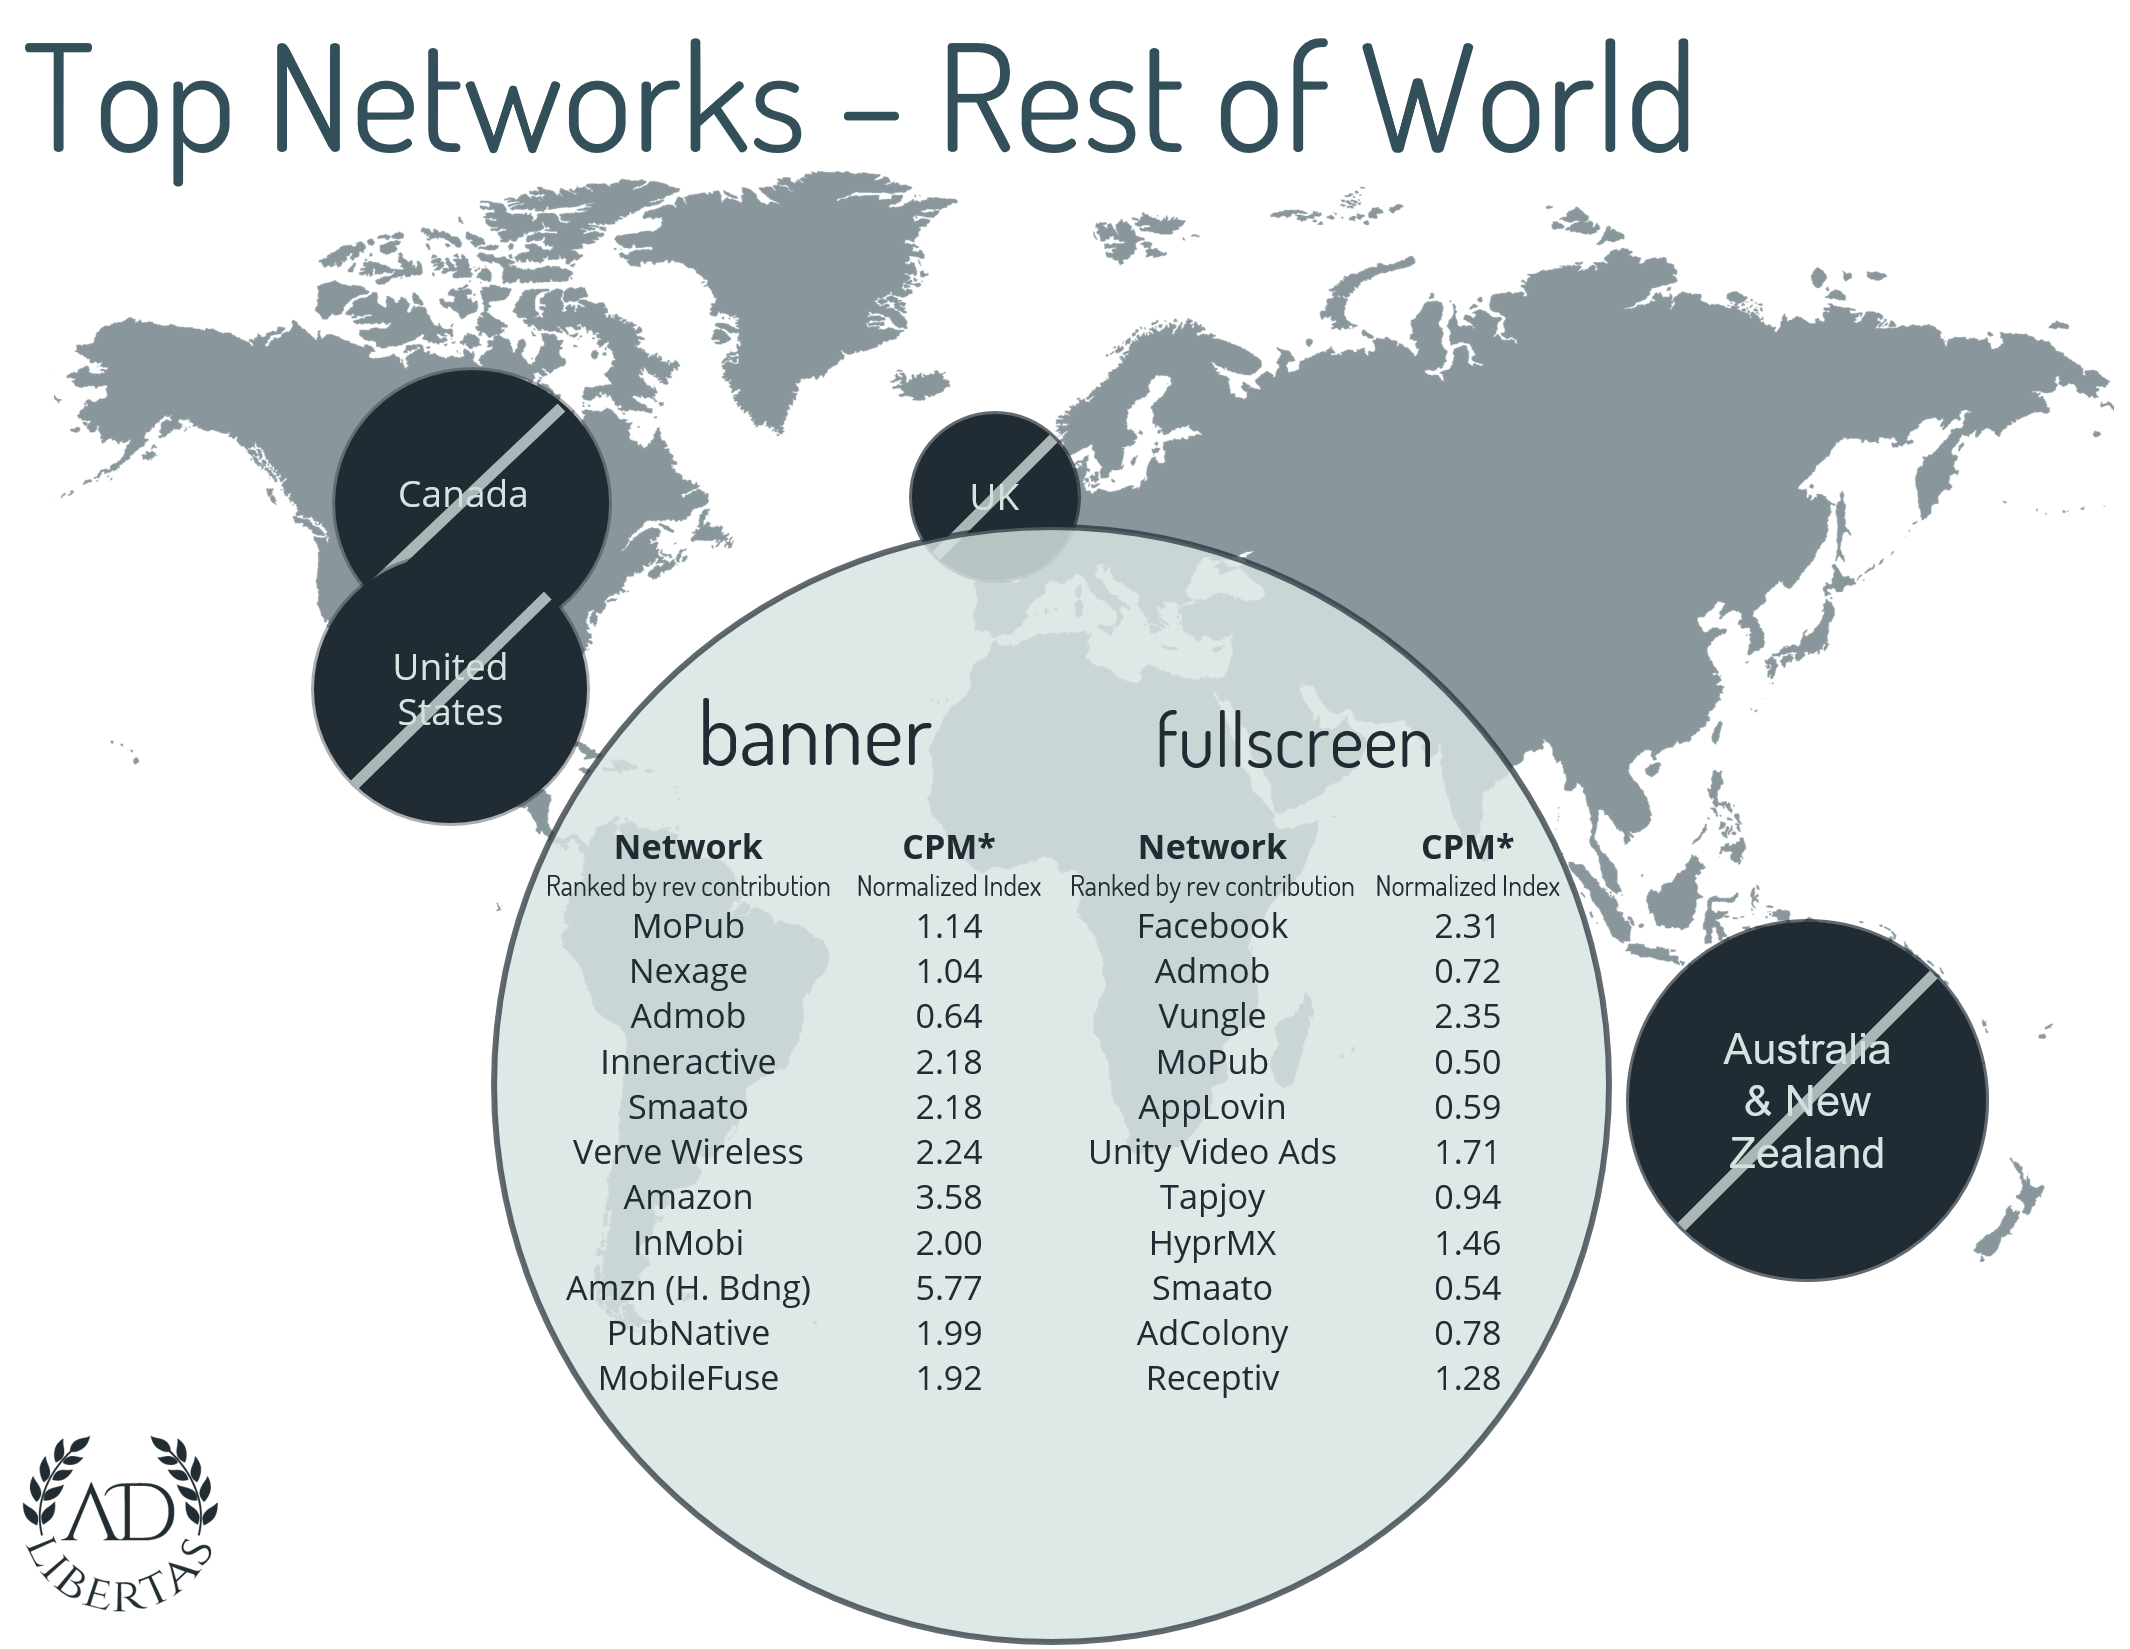
The concentration– and performance– of app traffic can skew by geography by publisher, app and even platform. We’ve broken down top-network performance by the top 3 segments of most publisher earnings. Ranking is listed by volume, CPMs are given in a normalized index.
Note networks are ranked by revenue contribution and the CPM is based on a normalized index where the value is a multiple of the entire region’s CPM average.
Click image for larger resolution.
For most publishers the US represents the largest single segment of inventory earnings.
Click image for higher resolution.
English Speaking is defined as Canada, United Kingdom, Australia and New Zealand and often represents the second-largest segment of publisher earnings.


