Top Ad Network Performance for 2020
Top Ad Network Performance for 2020
After the soaring highs of December earnings, mobile publishers often take advantage of the January lull to re-evaluate the ad stack and make adjustments where necessary. To assist we’ve provided our traditional look-back at Q4’s top performing ad networks; the goal of this article is to provide you some high-level guidance on the networks where you may be missing potential.
As always we’ve provided an aggregated indexed summary of US network performance — but by popular request we’ve included specific comparisons of ad unit types.
Before we begin, some definitions:
- Fair Representation: To avoid misrepresenting performance, only networks are included who’ve representative sufficient market share, or the top 10, whichever is smaller.
- CPM Index: is calculated using the data-set average CPM.
- Revenue contribution: only includes the subset represented (not total revenue).
Ad Type Performance Breakdown
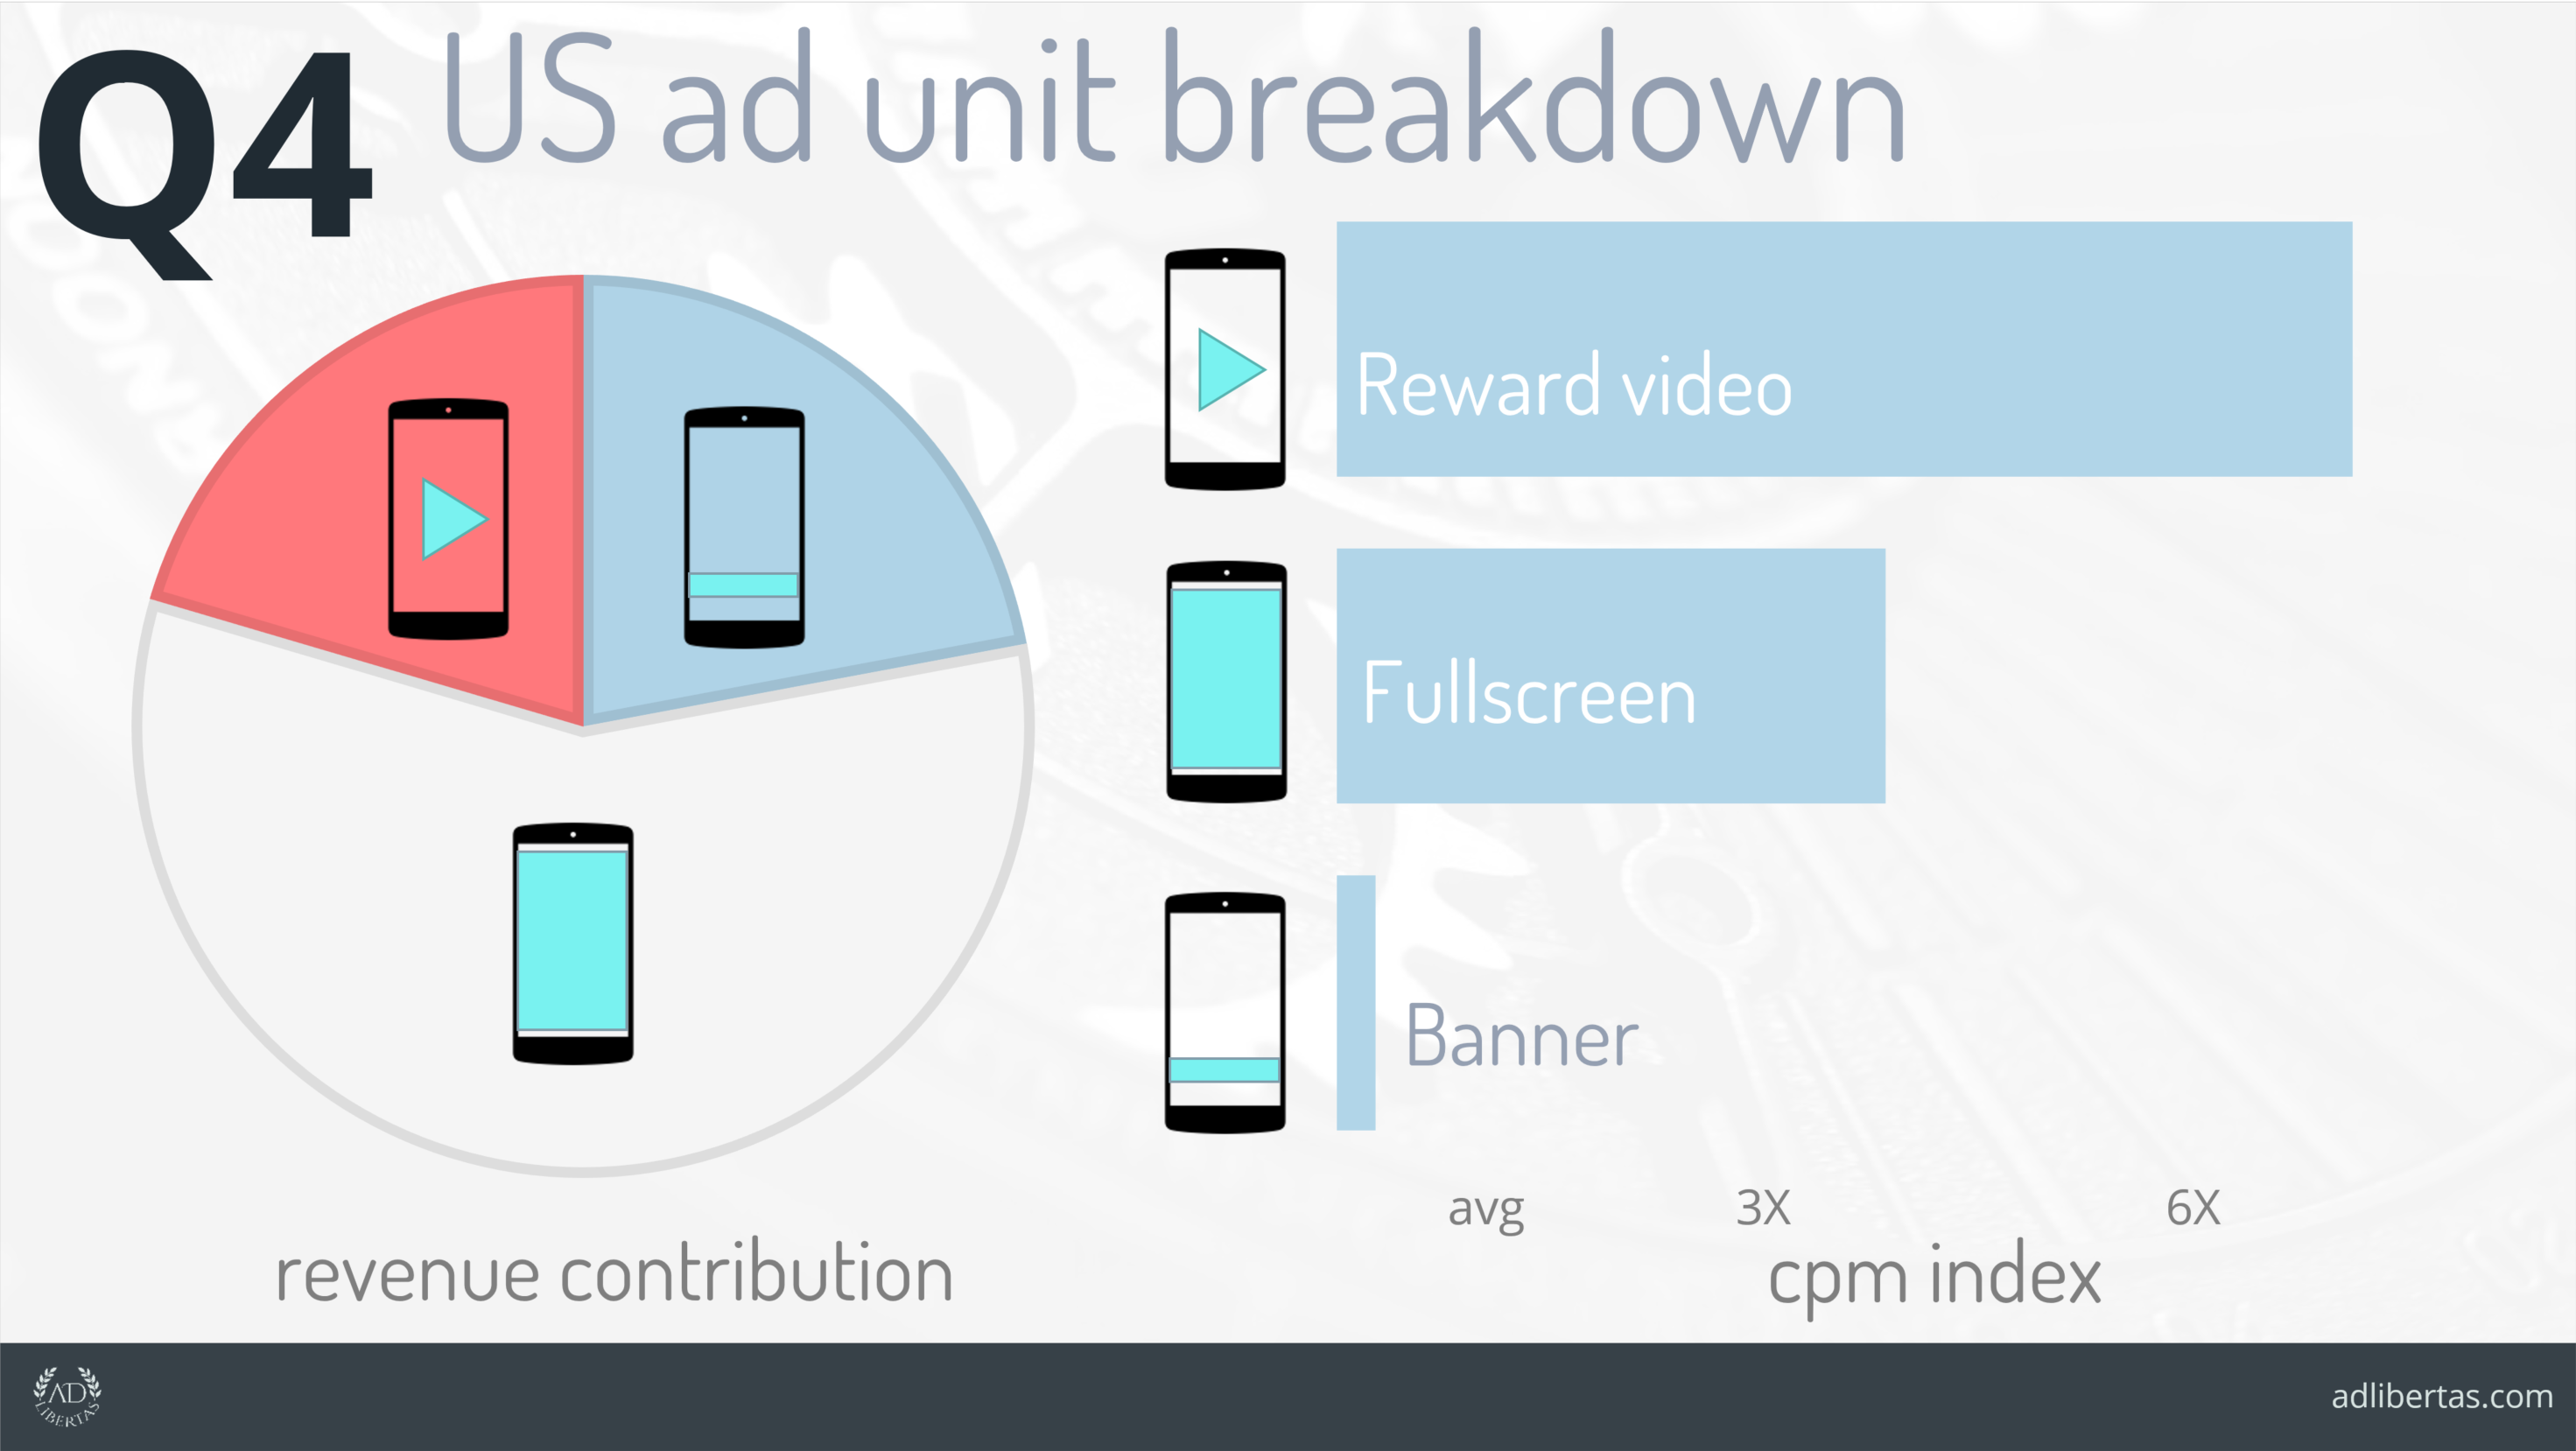
Included by popular demand, we’ve outlined US-average revenue contribution by ad-type as well as the indexed CPM performance.
Notable Takeaways:
- Fullscreen revenue makes up the majority of revenue-earned, more than banner & reward video combined.
- Fullscreen CPMs are 3.5X the average CPM, a full 10X above banner’s average. Reward video, 20X.
- But don’t count banners out: although obviously below average in CPMs, banners still managed to generate a significant portion of revenue; there is a lot of banner inventory in the wild and it still makes significant revenue for those reliant on the format.
A single interstitial can earn more than 10 banner impressions. A single reward video earns more than 20 banners.
Top Banner Networks
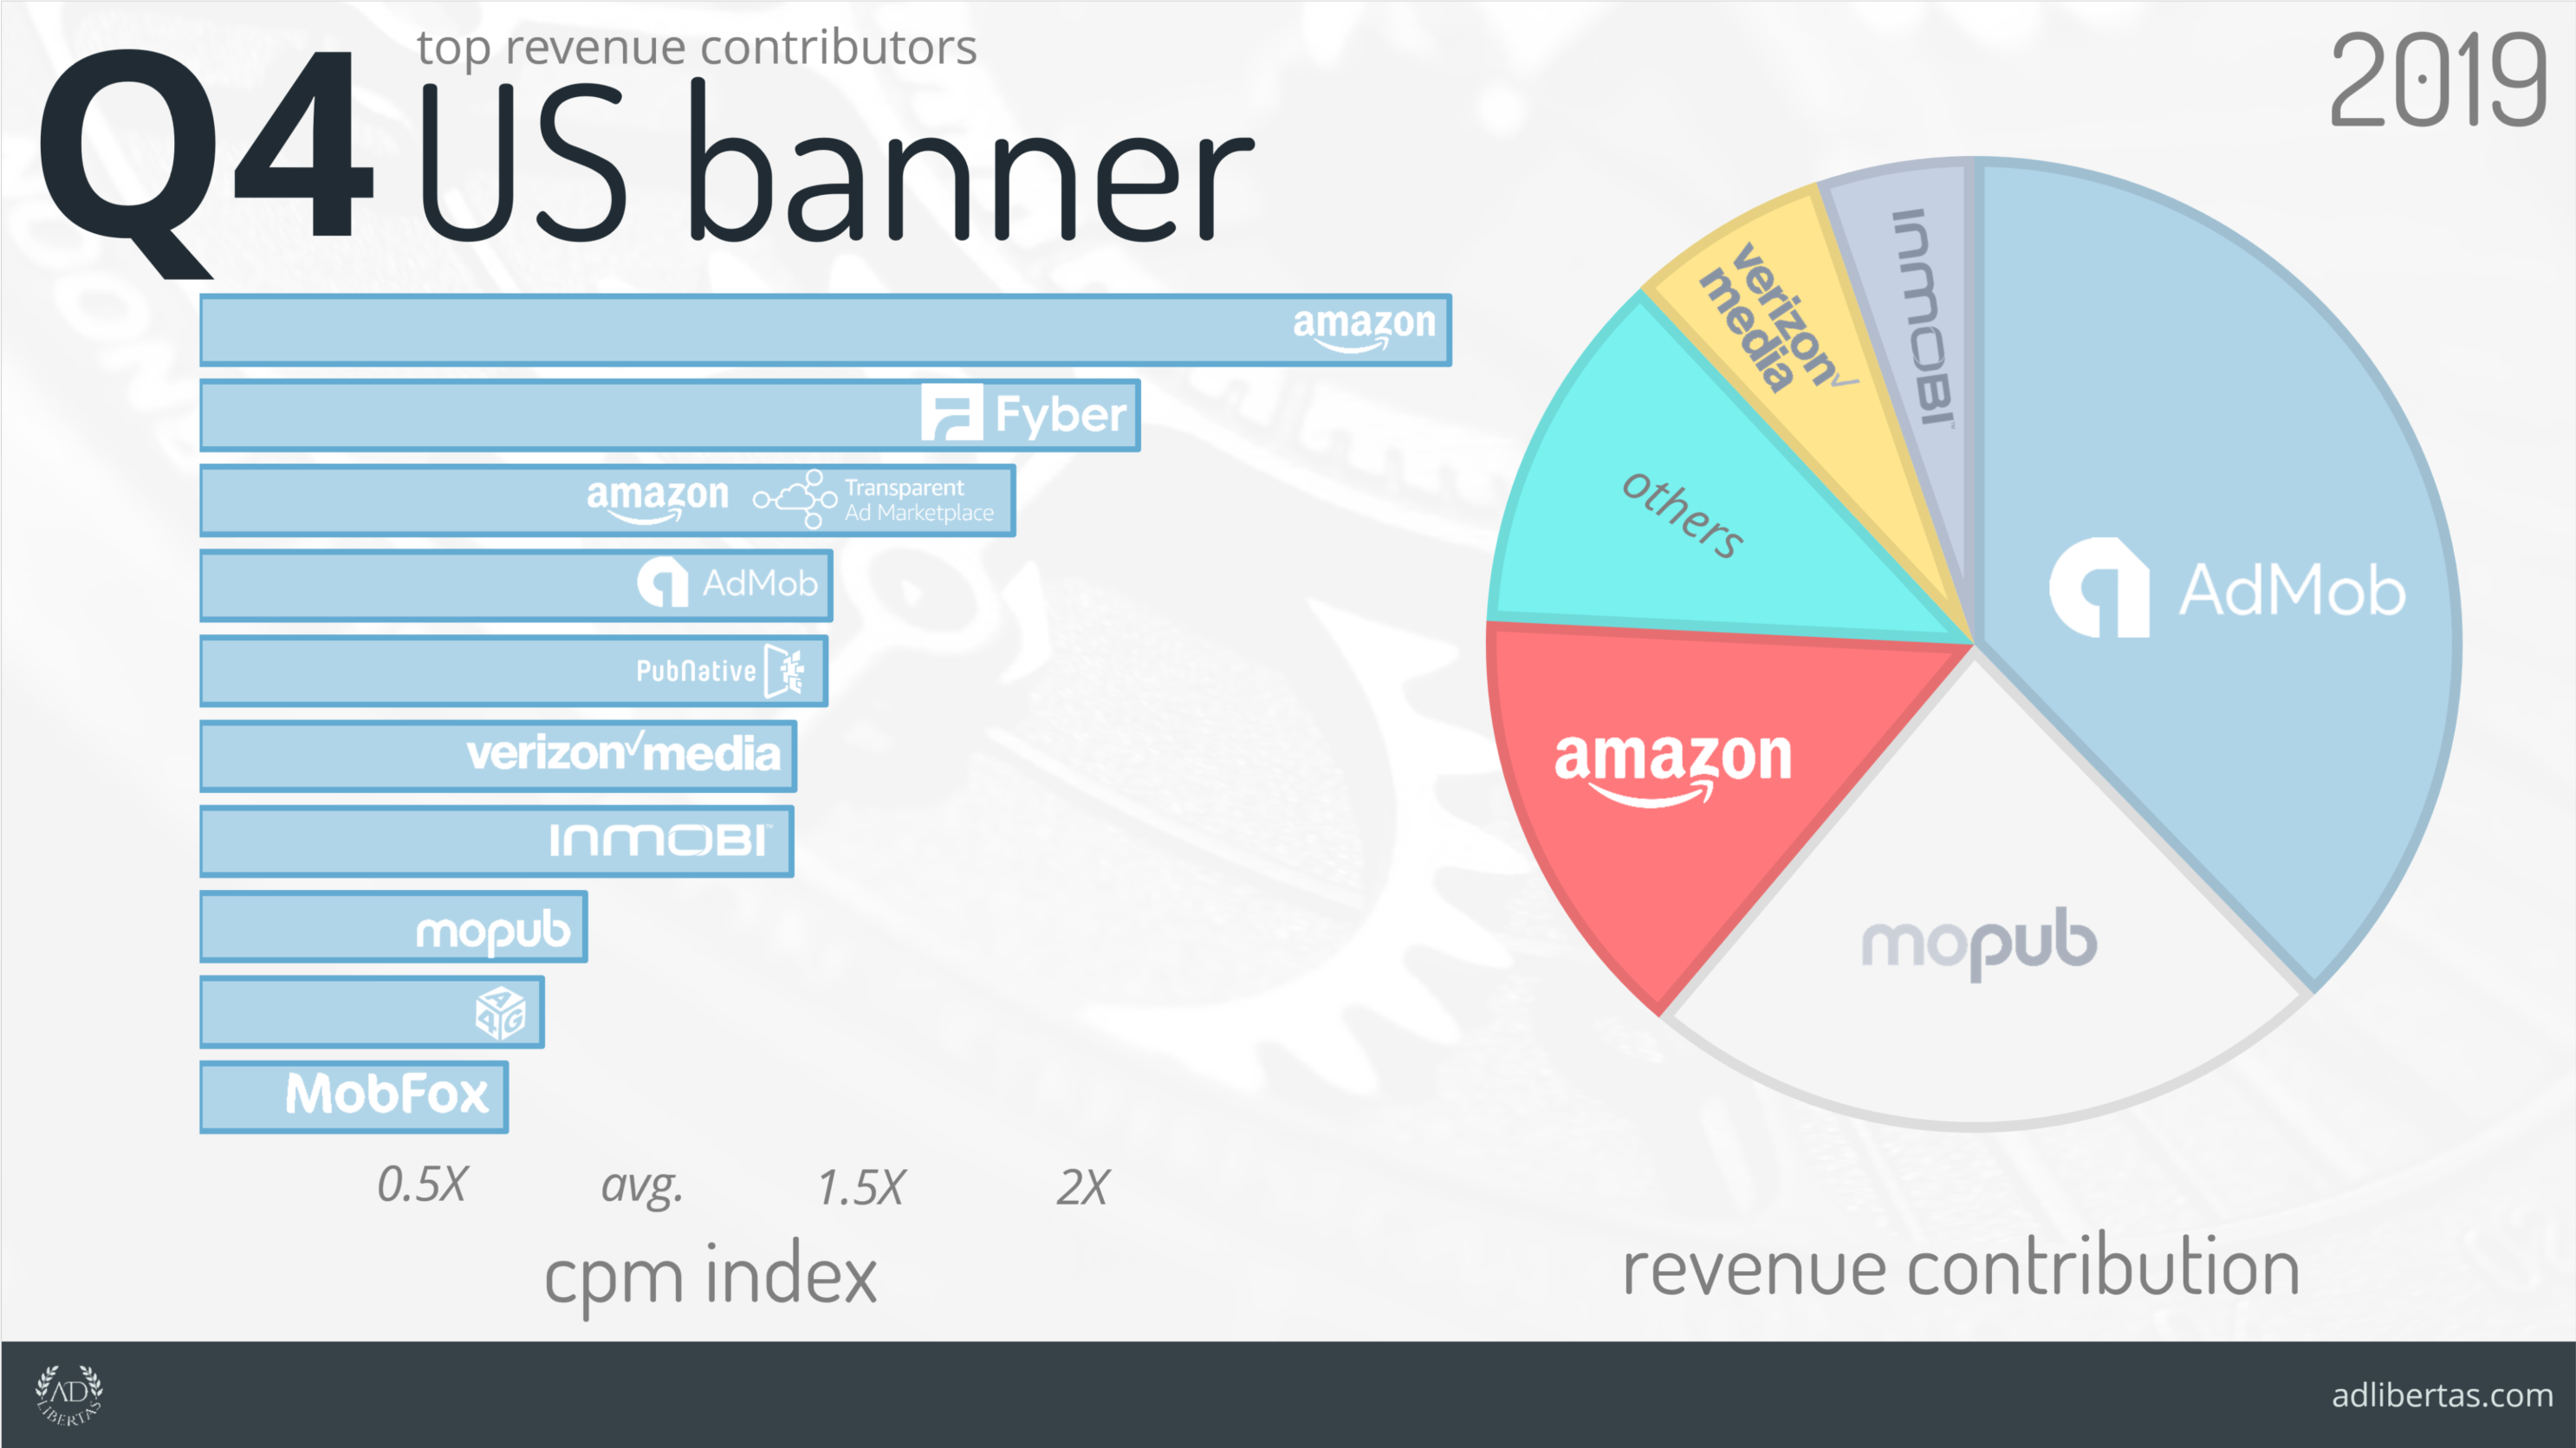
In a trend we’ve seen through 2019 — the top earners have continually consolidated into a handful of meaningful players. Among the top 10 players we’ve seen roughly half of the networks make up the vast majority of the revenue. Down from 9 this time last year. Also, the top CPM producers have narrowed the gap in competition — where the top players were 5X the average in previous posts, we’re seeing a much more normalized spread of CPM performance.
Top Fullscreen Networks
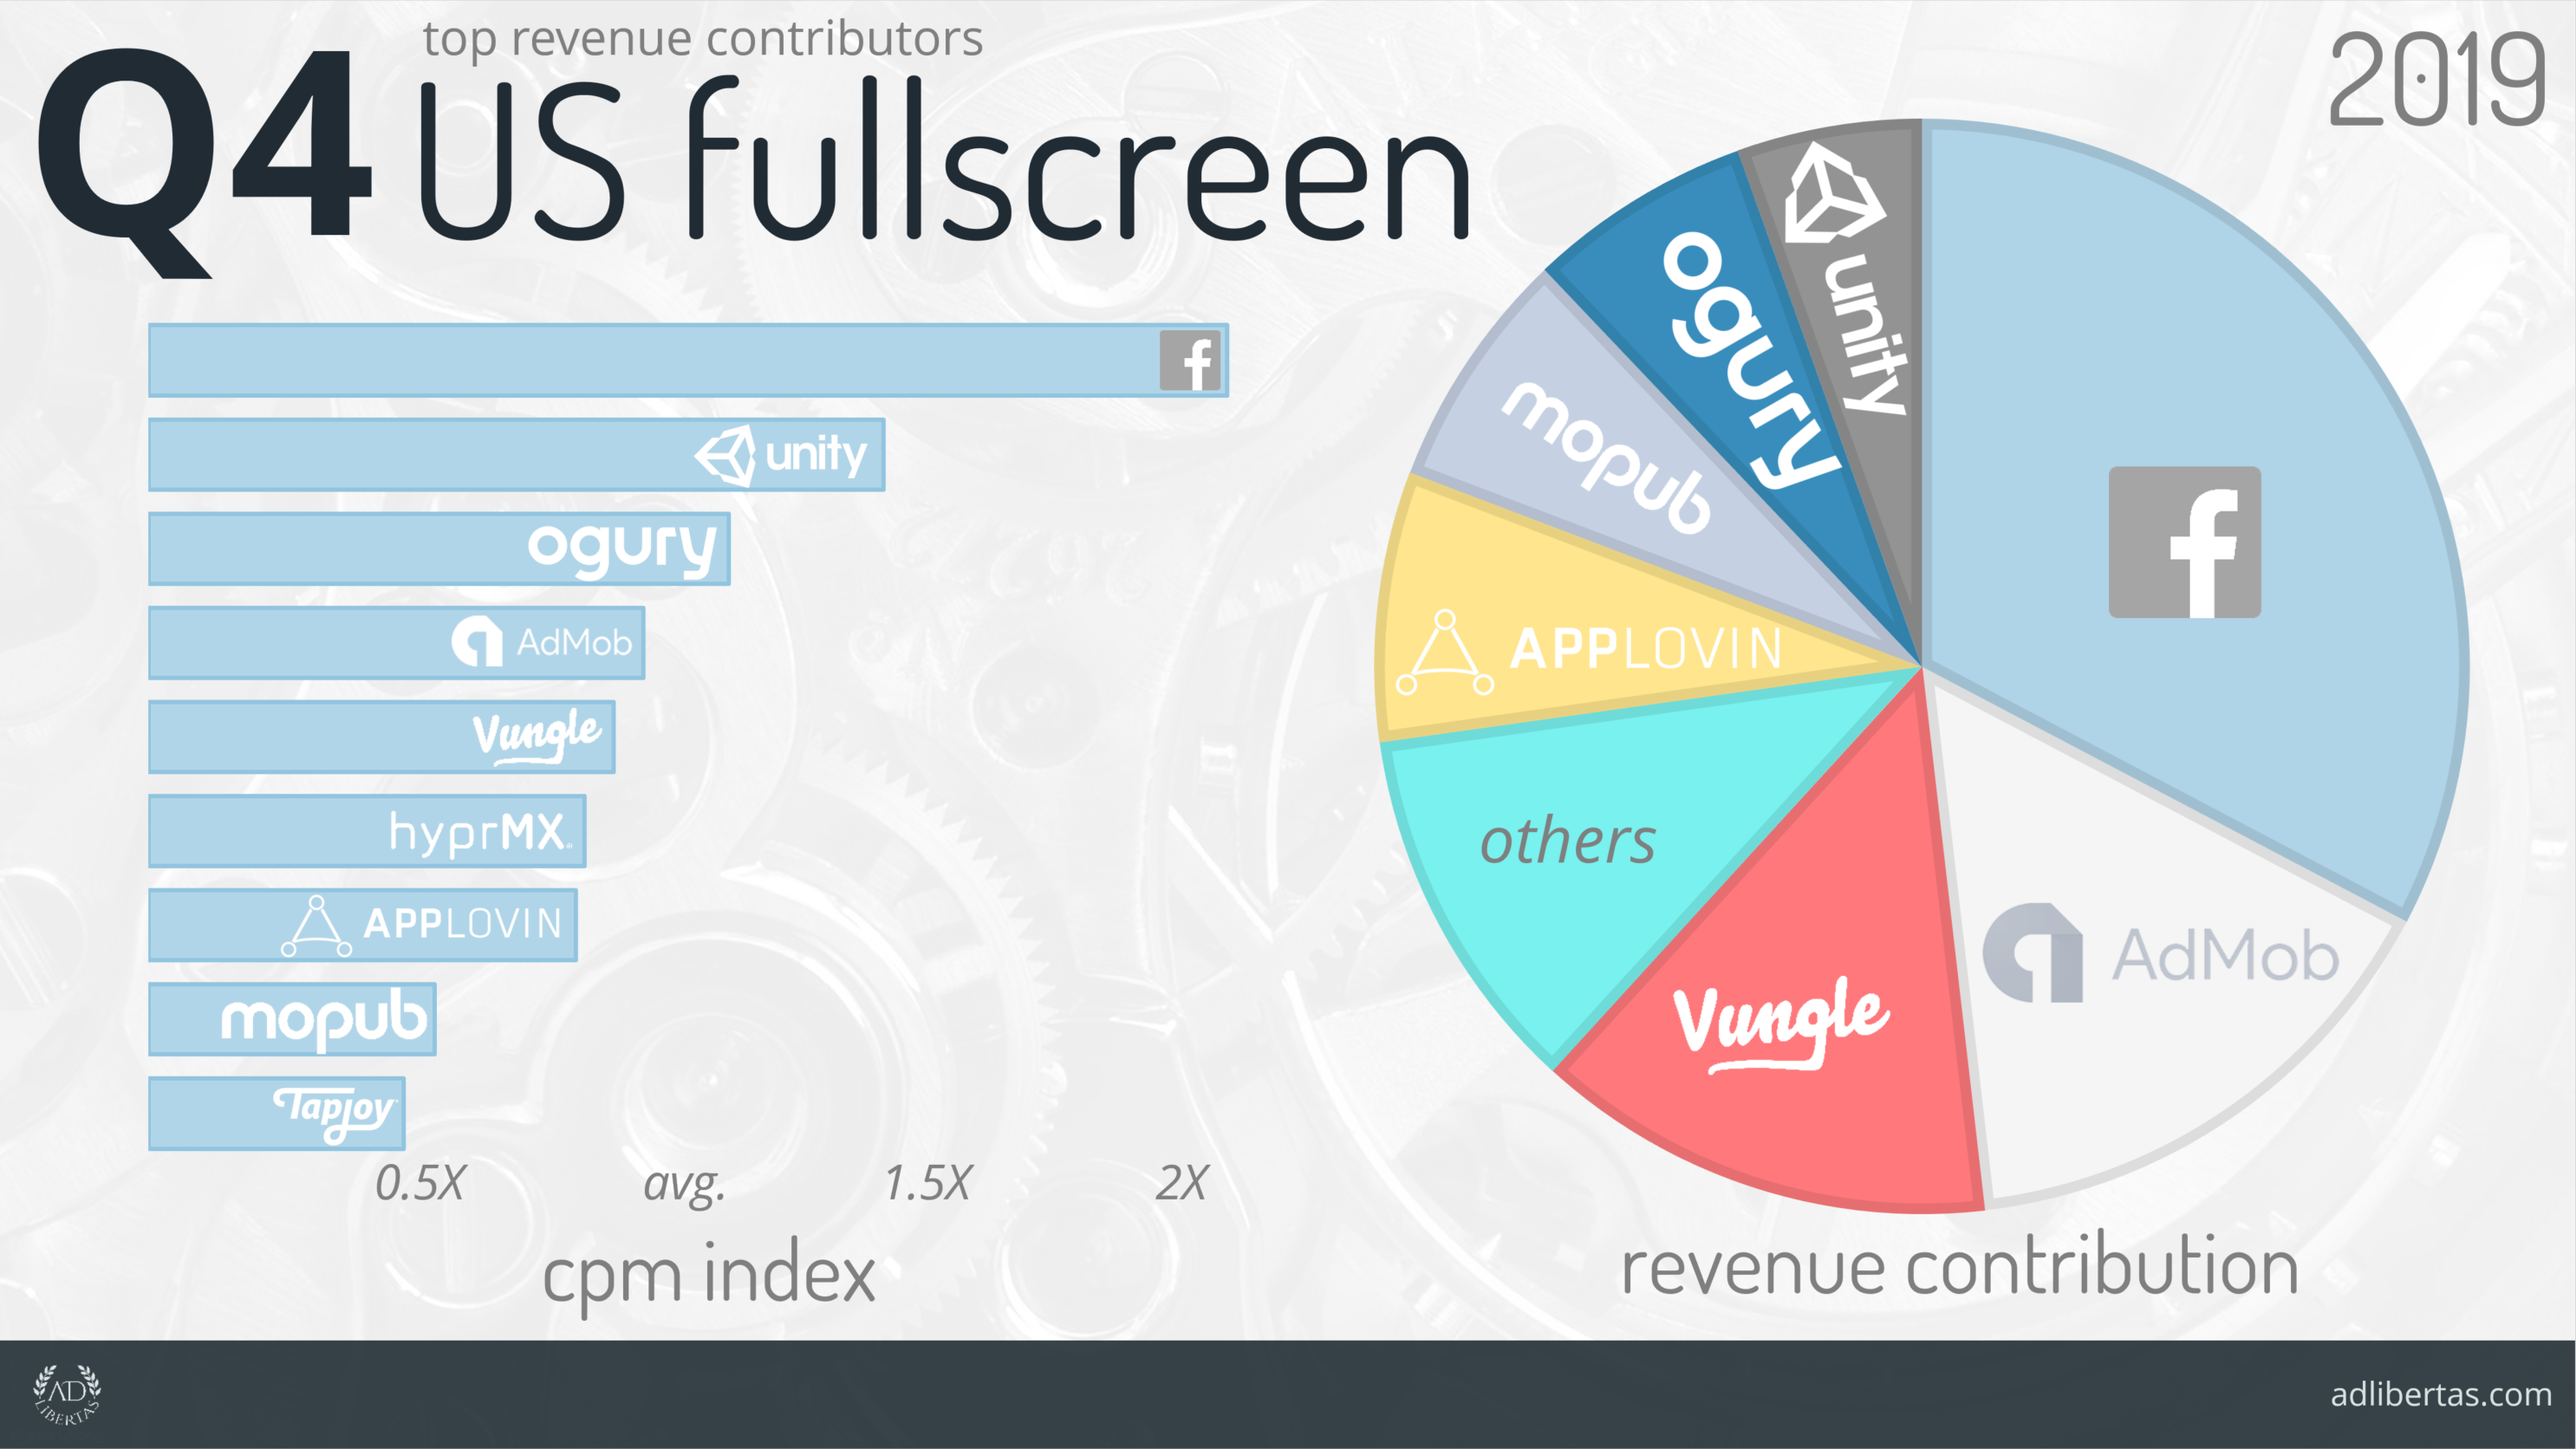
No huge changes from last year, Facebook continues to dominate market-share & indexed CPM performance. Another noteworthy addition is Ogury into the top revenue-contributors — while previously strong with CPM they’ve stepped up in volume recently, especially noteworthy as they primarily only buy on Android, making a top-earning seat that much more impressive.
Top Reward Video Networks
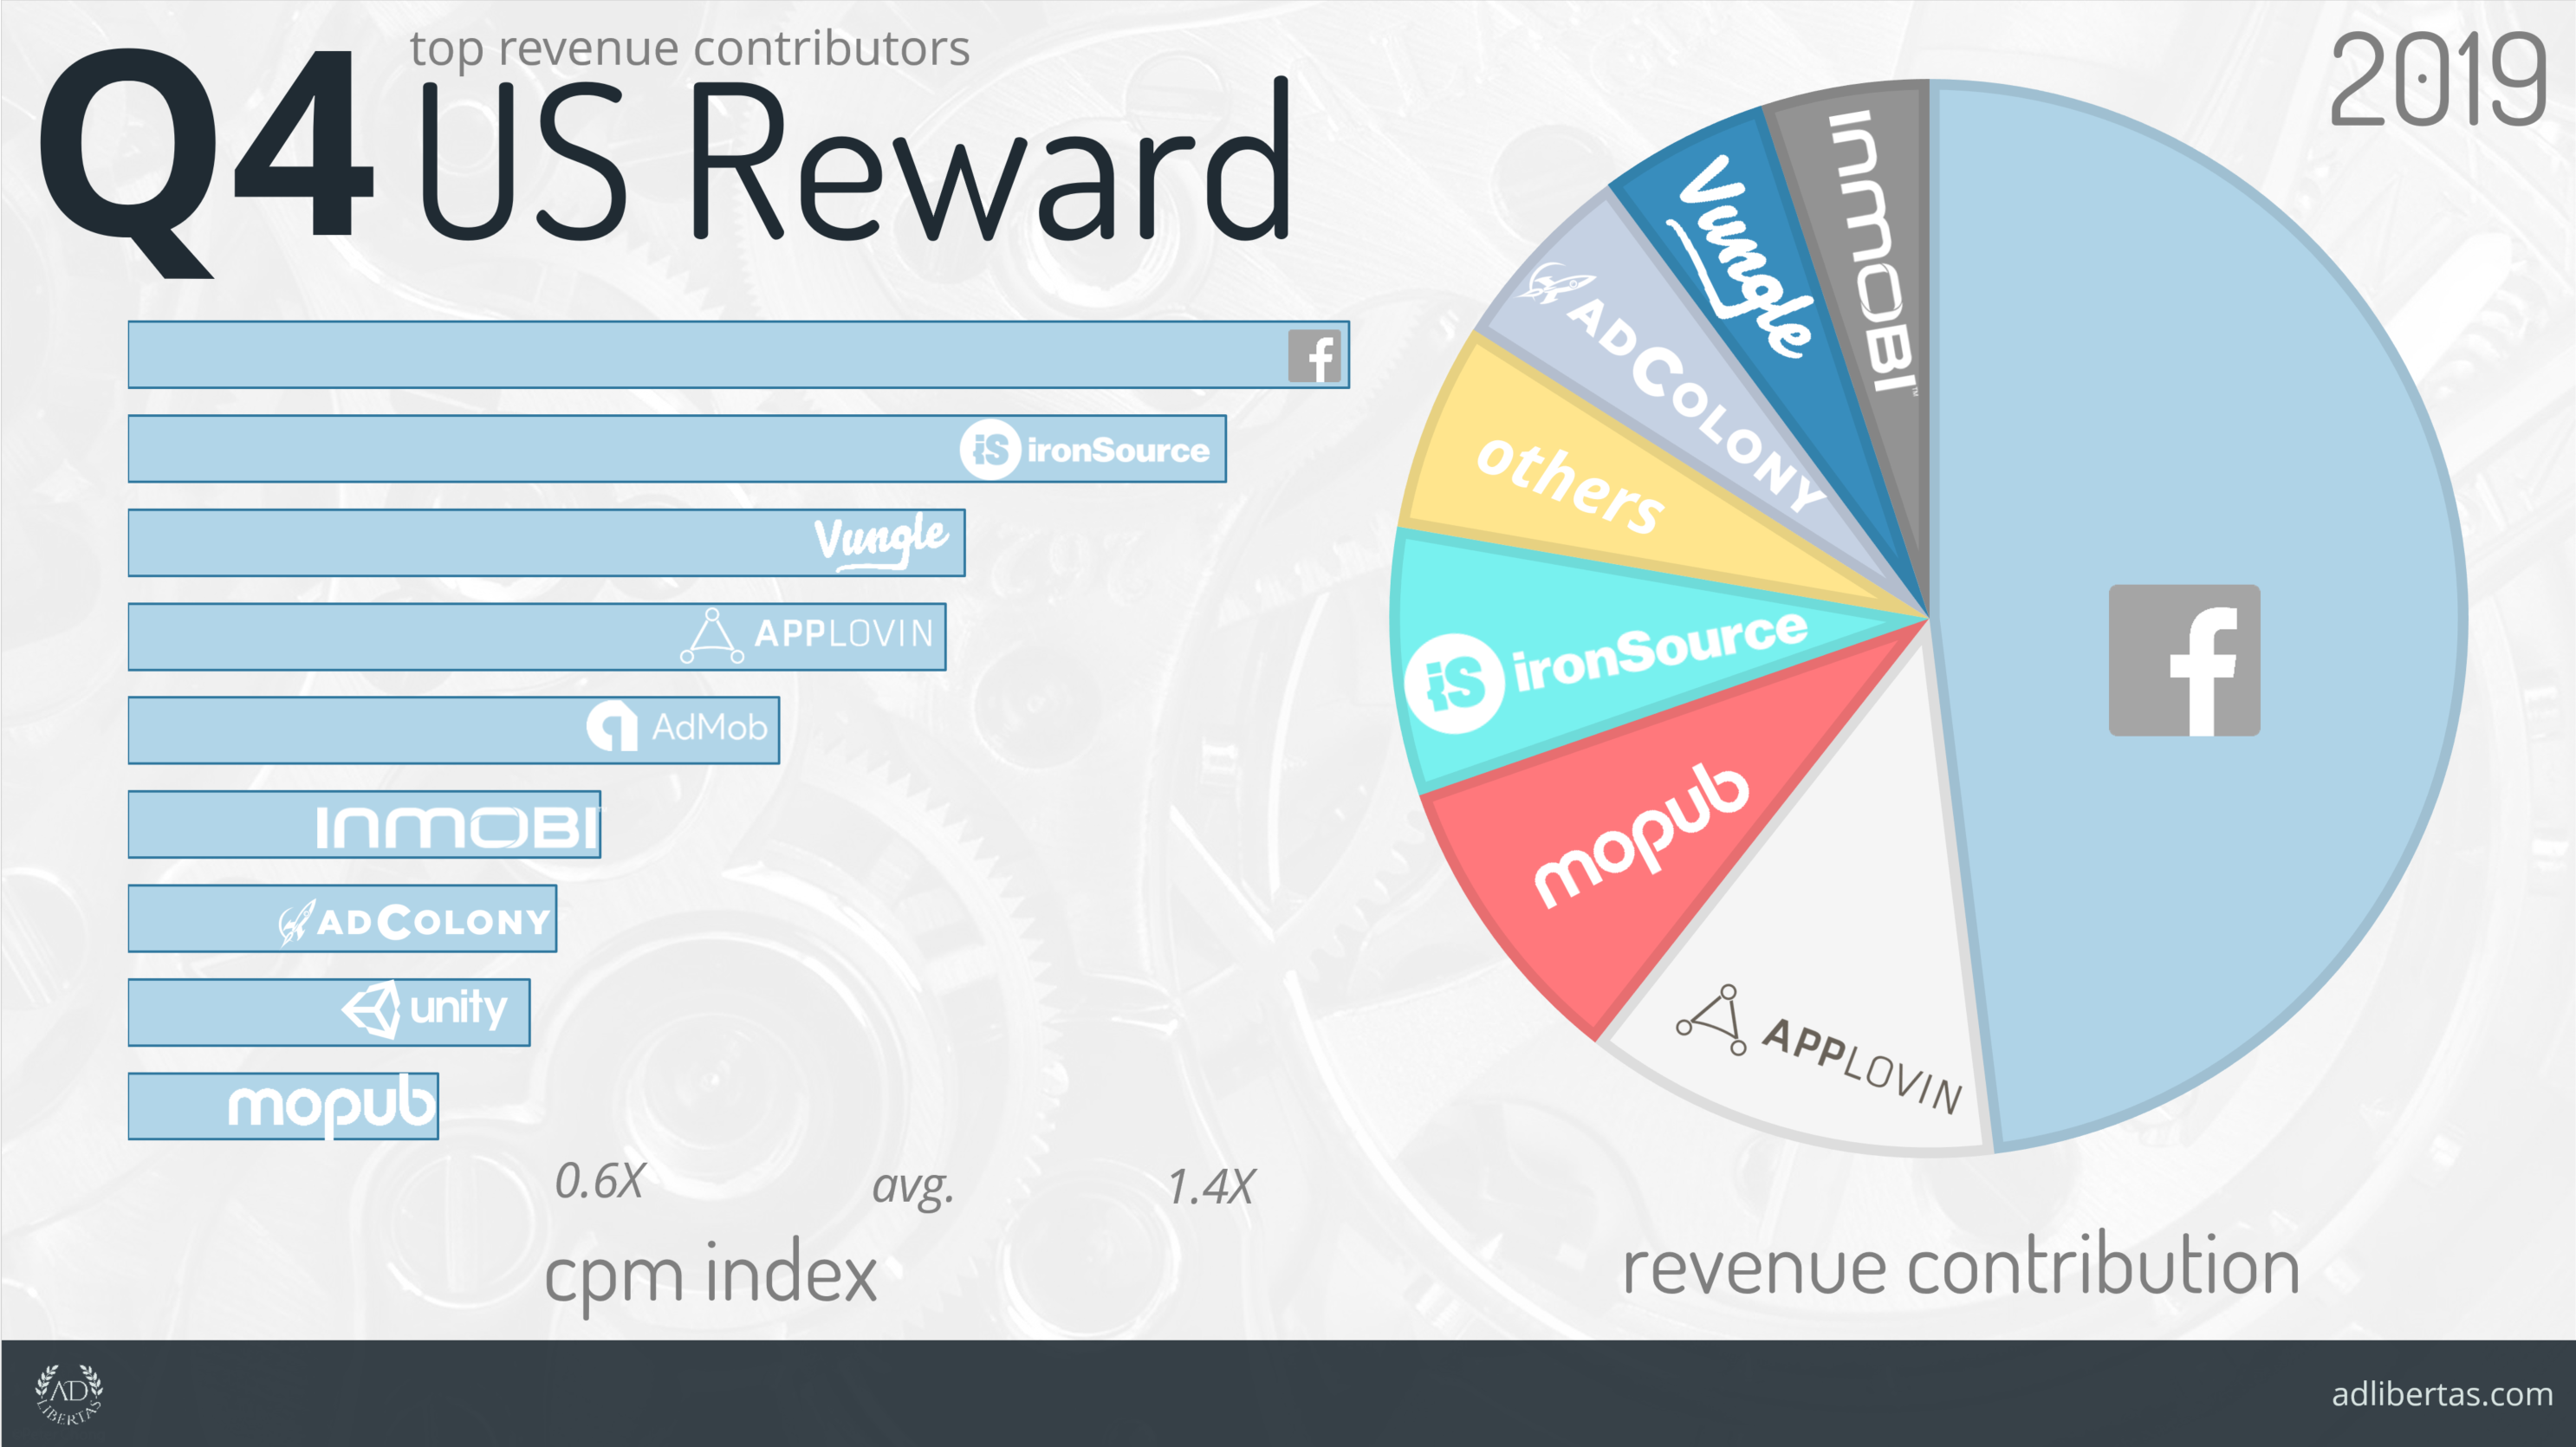
Facebook Reward Video continues to dominate both CPM performance as well as overall revenue contribution. A notable climber is MoPub, up to the number 3 revenue contributor. Also IronSource comes into the top earner list at number 4 with a very respectable second CPM performance behind Facebook.
Notes:
- Ad-unit sizes are based on MoPub’s definition.
- “Fullscreen” can include static, dynamic or even video creative served in this ad-size.
- CPM are indexed against the global market average.
- Numbers are based on network-reporting: serving discrepancies are not factored.