2019: Mid-Year Top Network Performance
2019: Mid-Year Top Network Performance
As we charge into the second-half of Q2 we’ve compiled our standard network performance index to help ensure you’re working with the proper partners. As usual we’ve aggregated the market performance in a CPM index and market-share across a wide-variety of inventory types to give you an aggregated summary of network performance.
Top Banner Networks
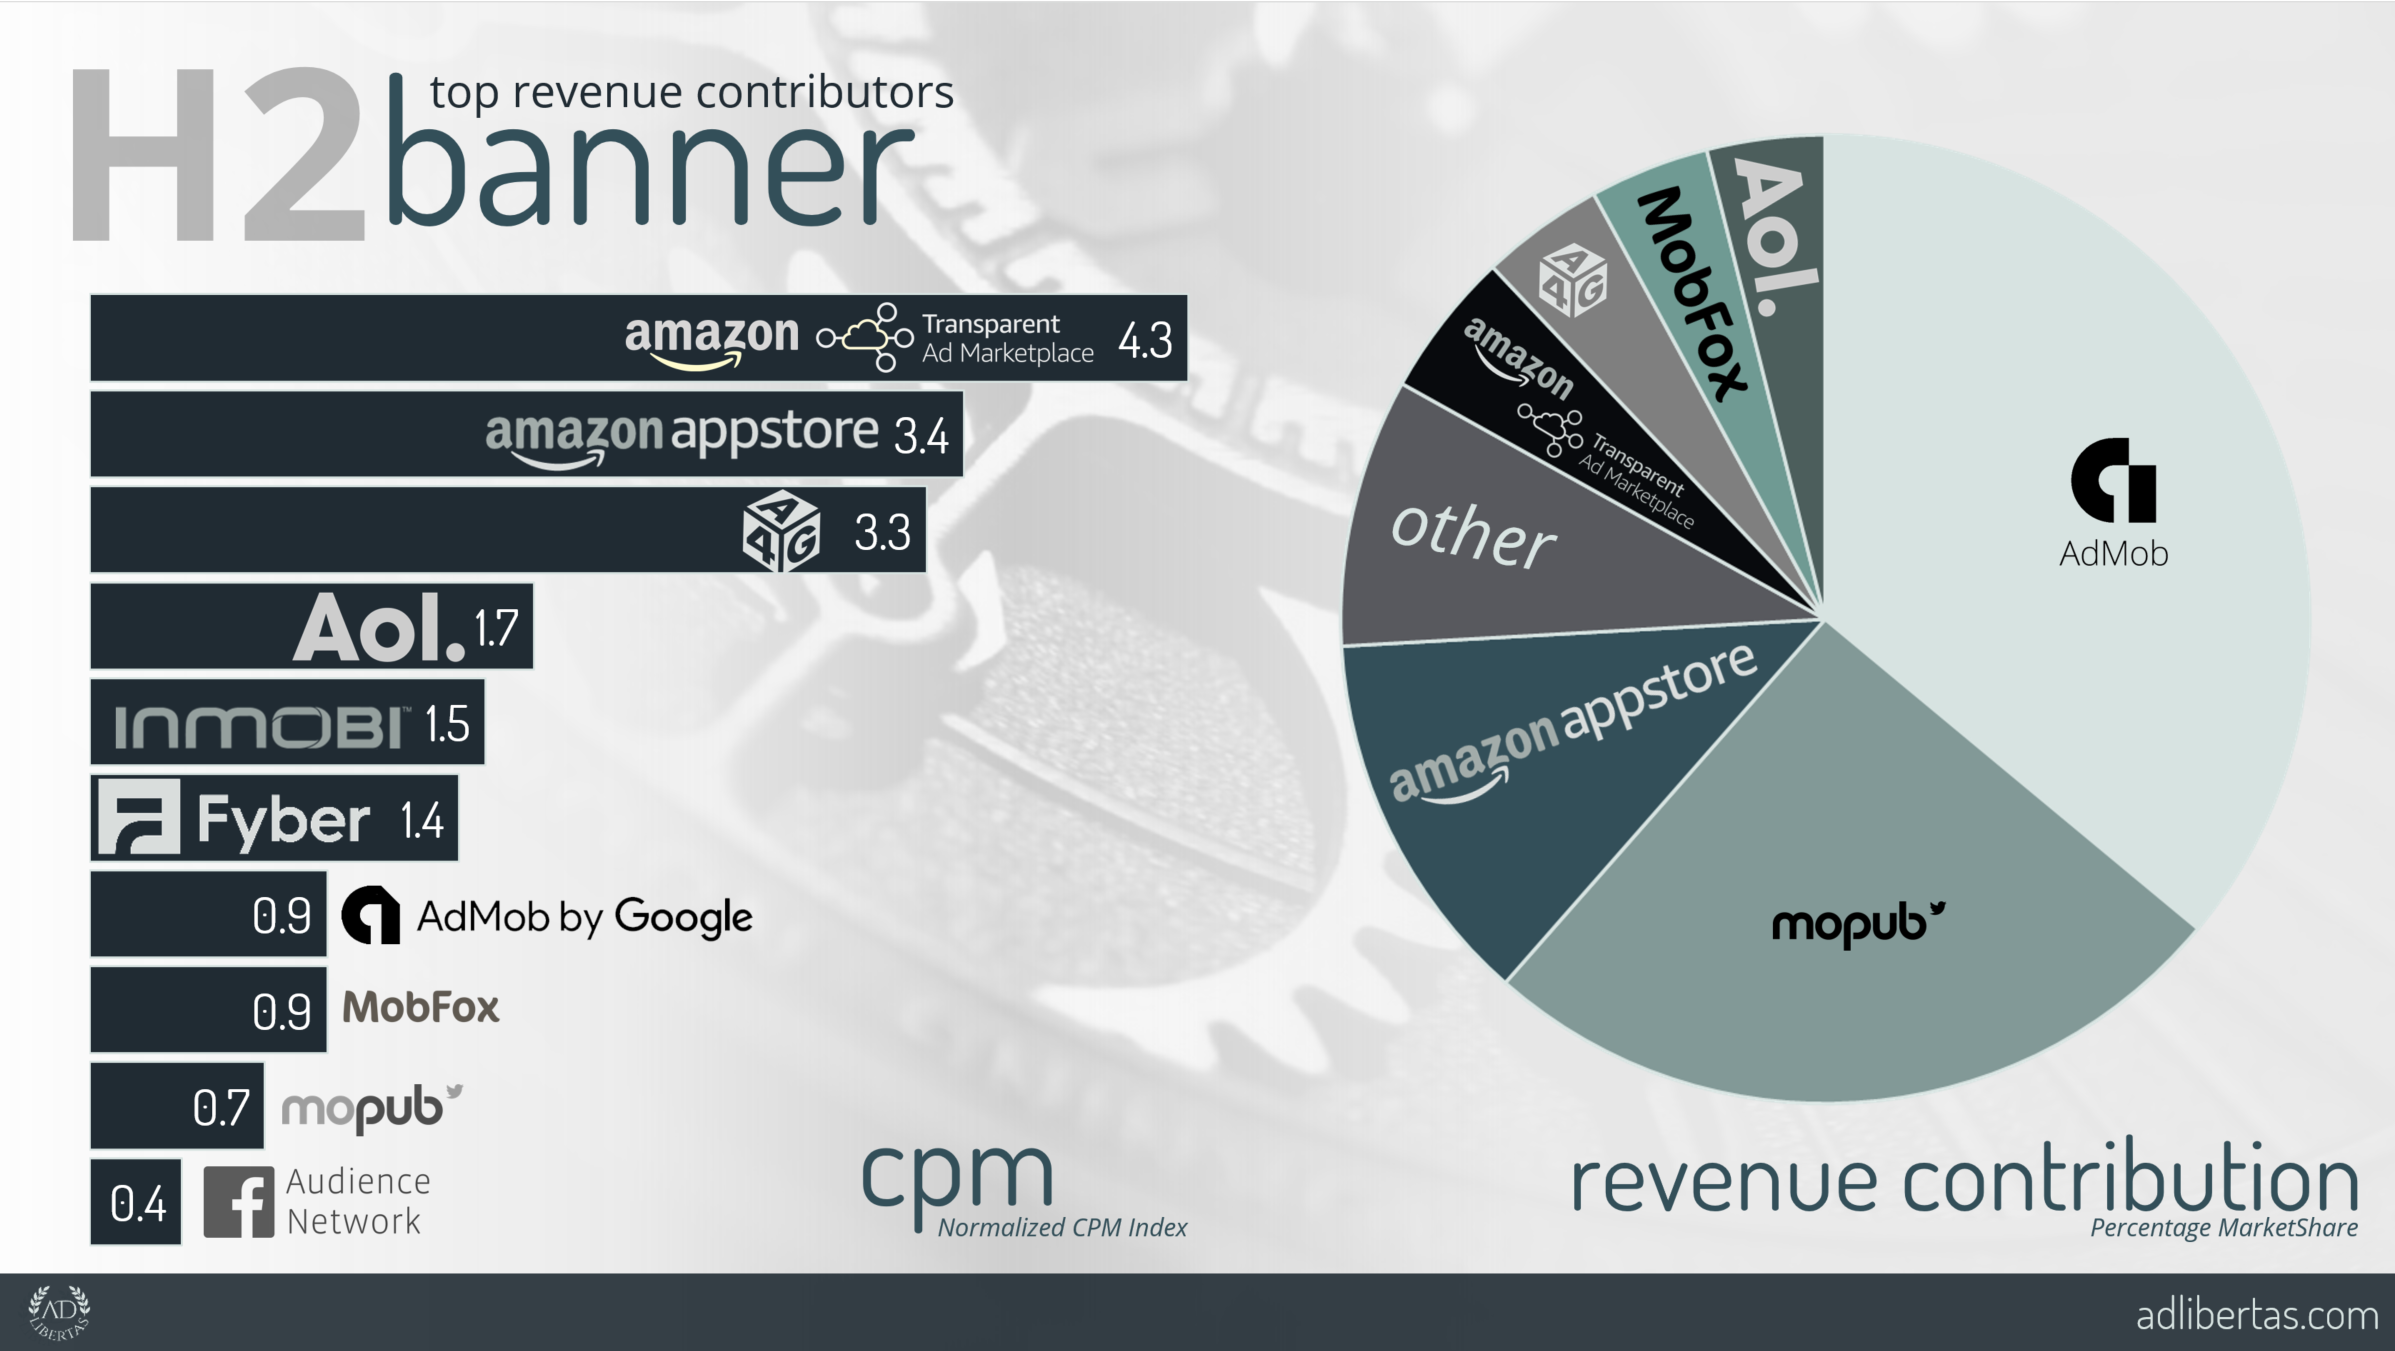
Note CPM is based on a normalized index where the value is a multiple of the entire CPM average.
Banner Regional Breakdown
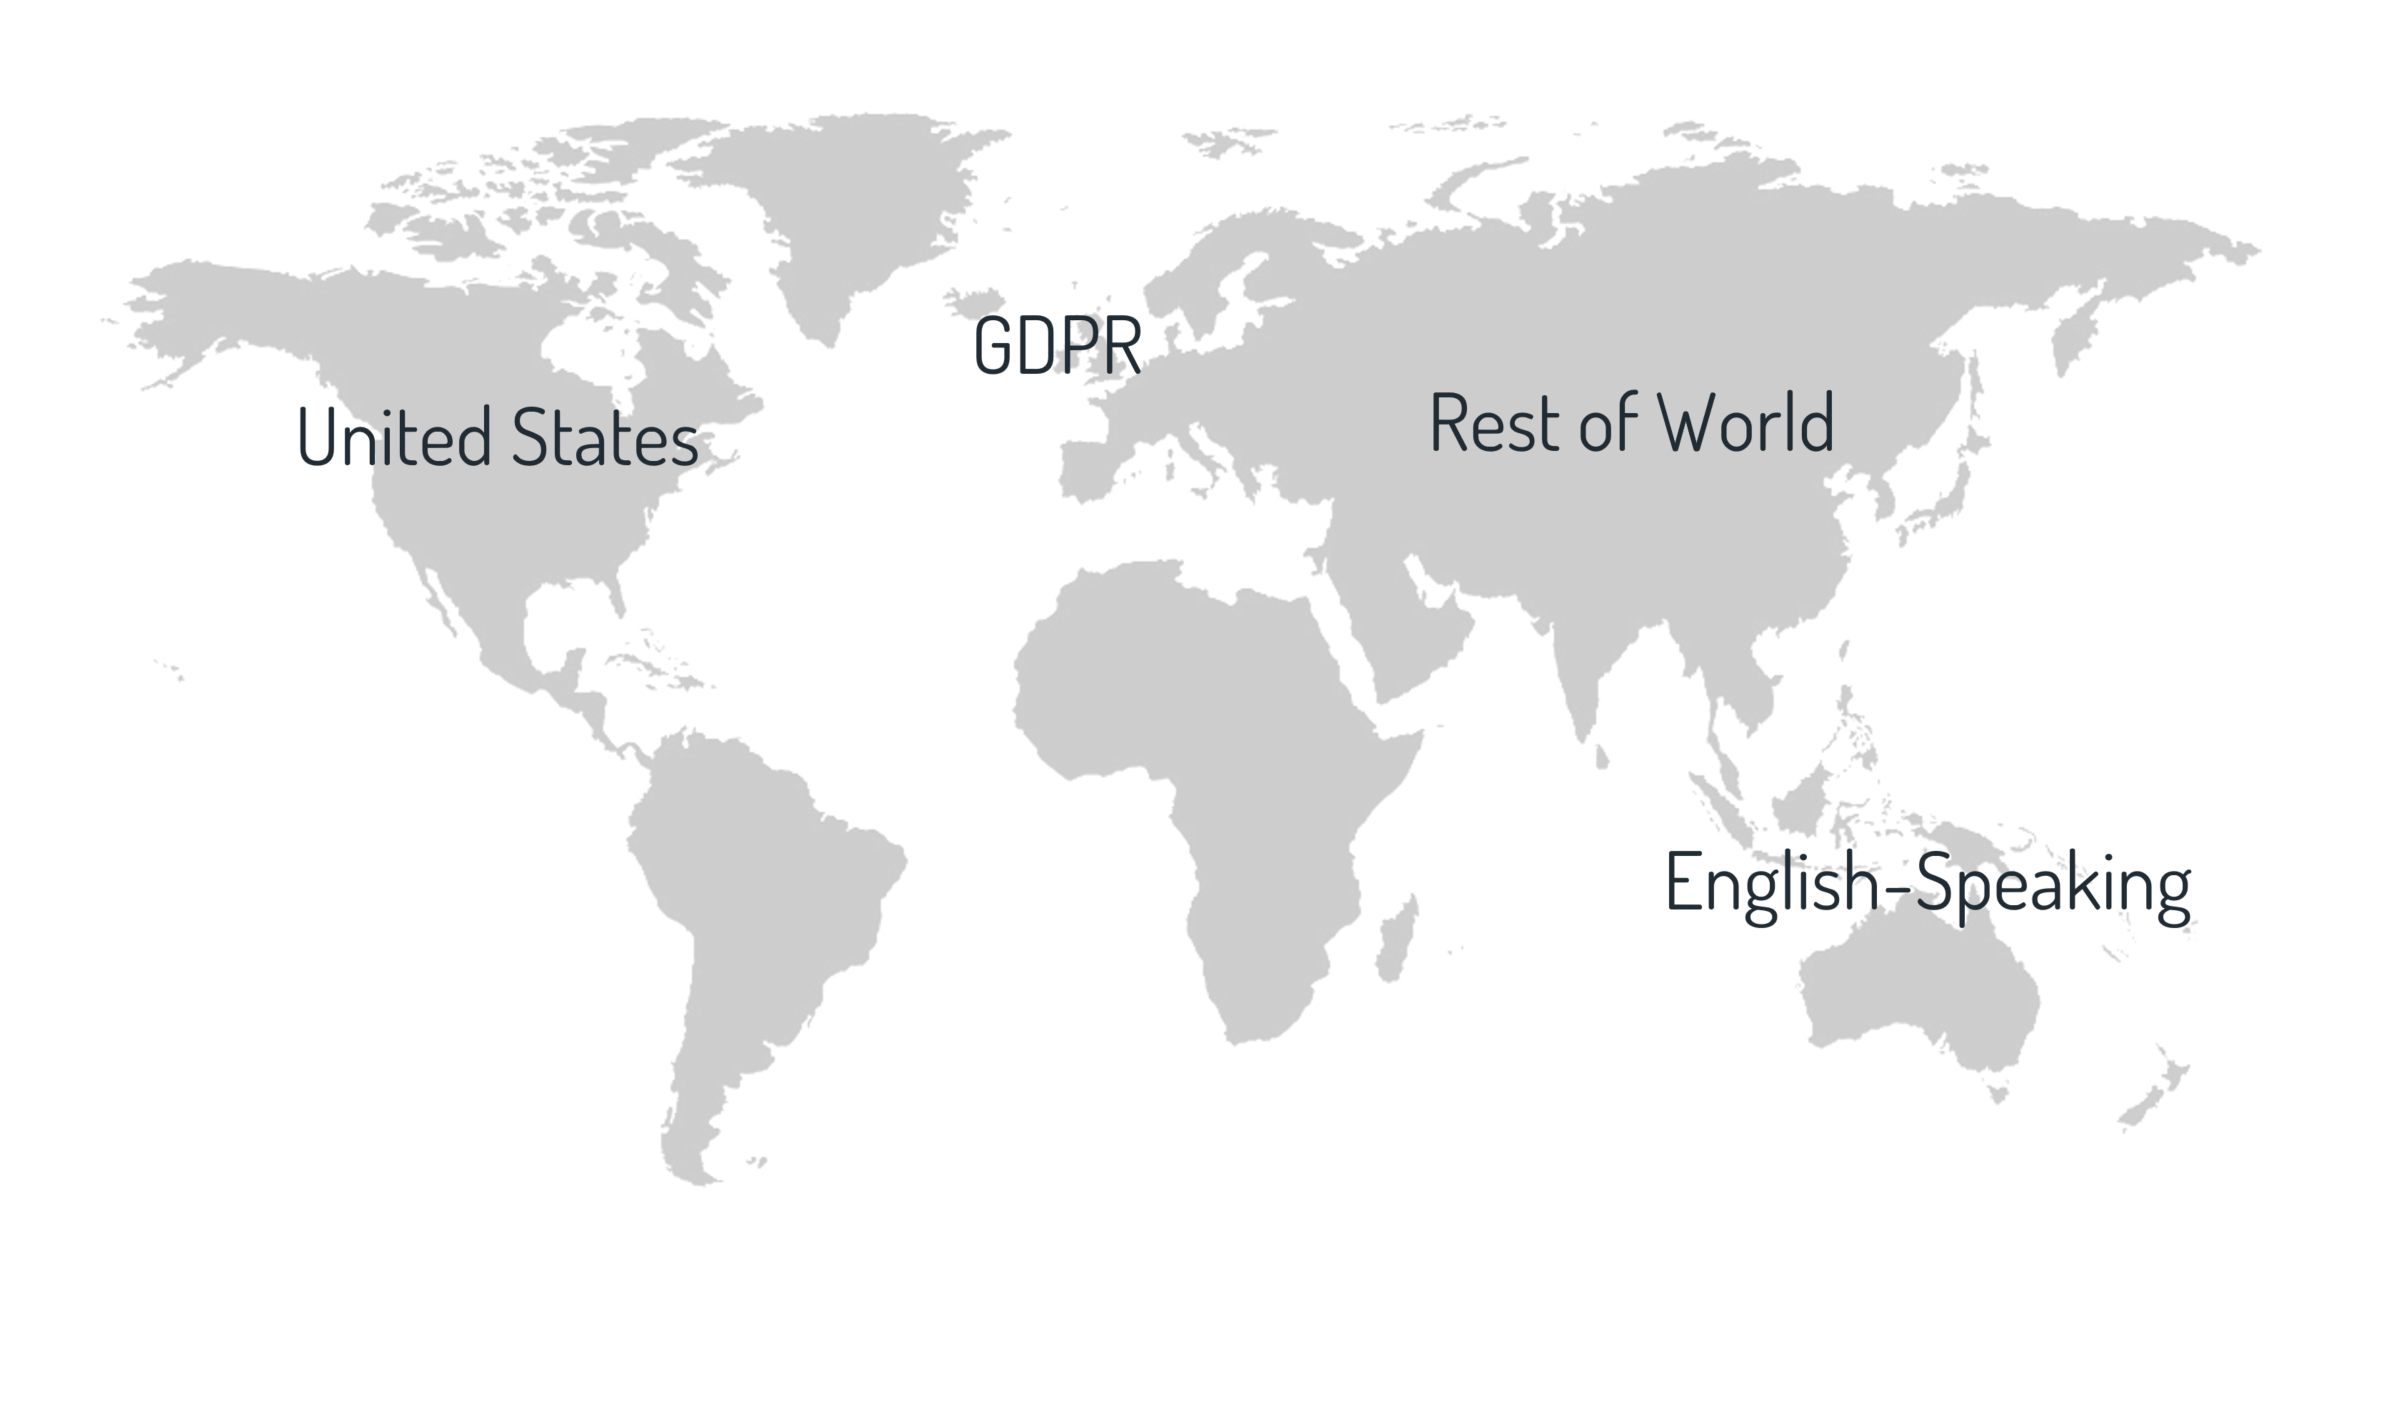


Highlight map for details
Top Fullscreen Networks
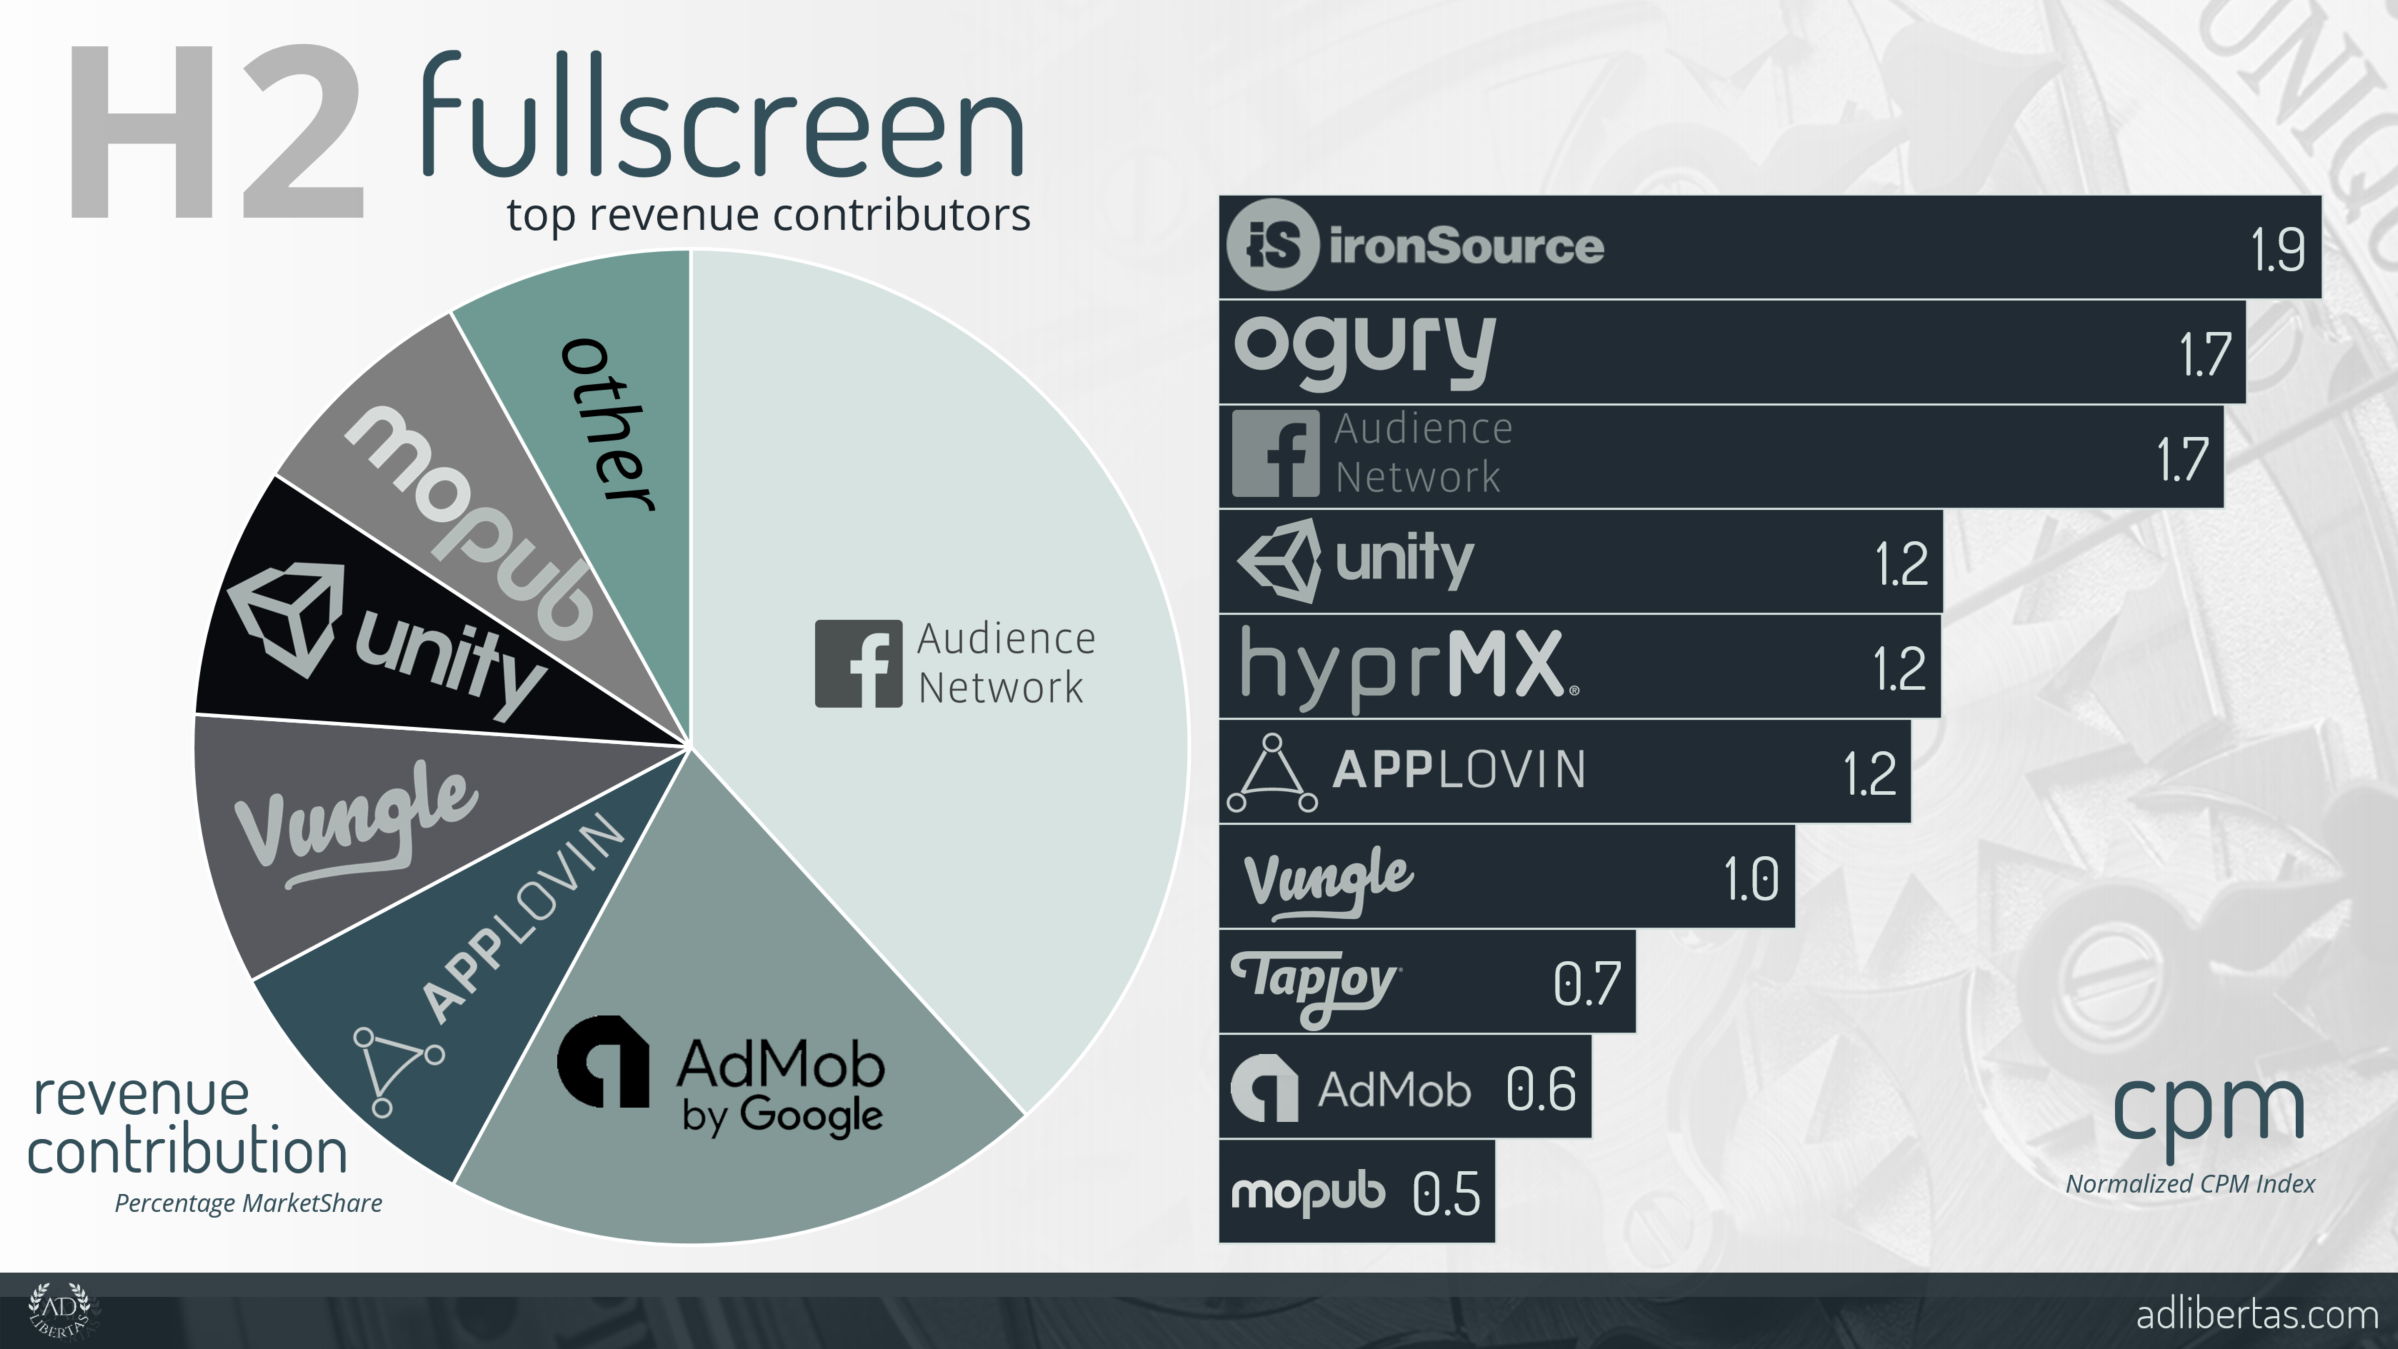
Note CPM is based on a normalized index where the value is a multiple of the entire CPM average.
Fullscreen Regional Breakdown
Highlight map for details
Top Reward Video Networks
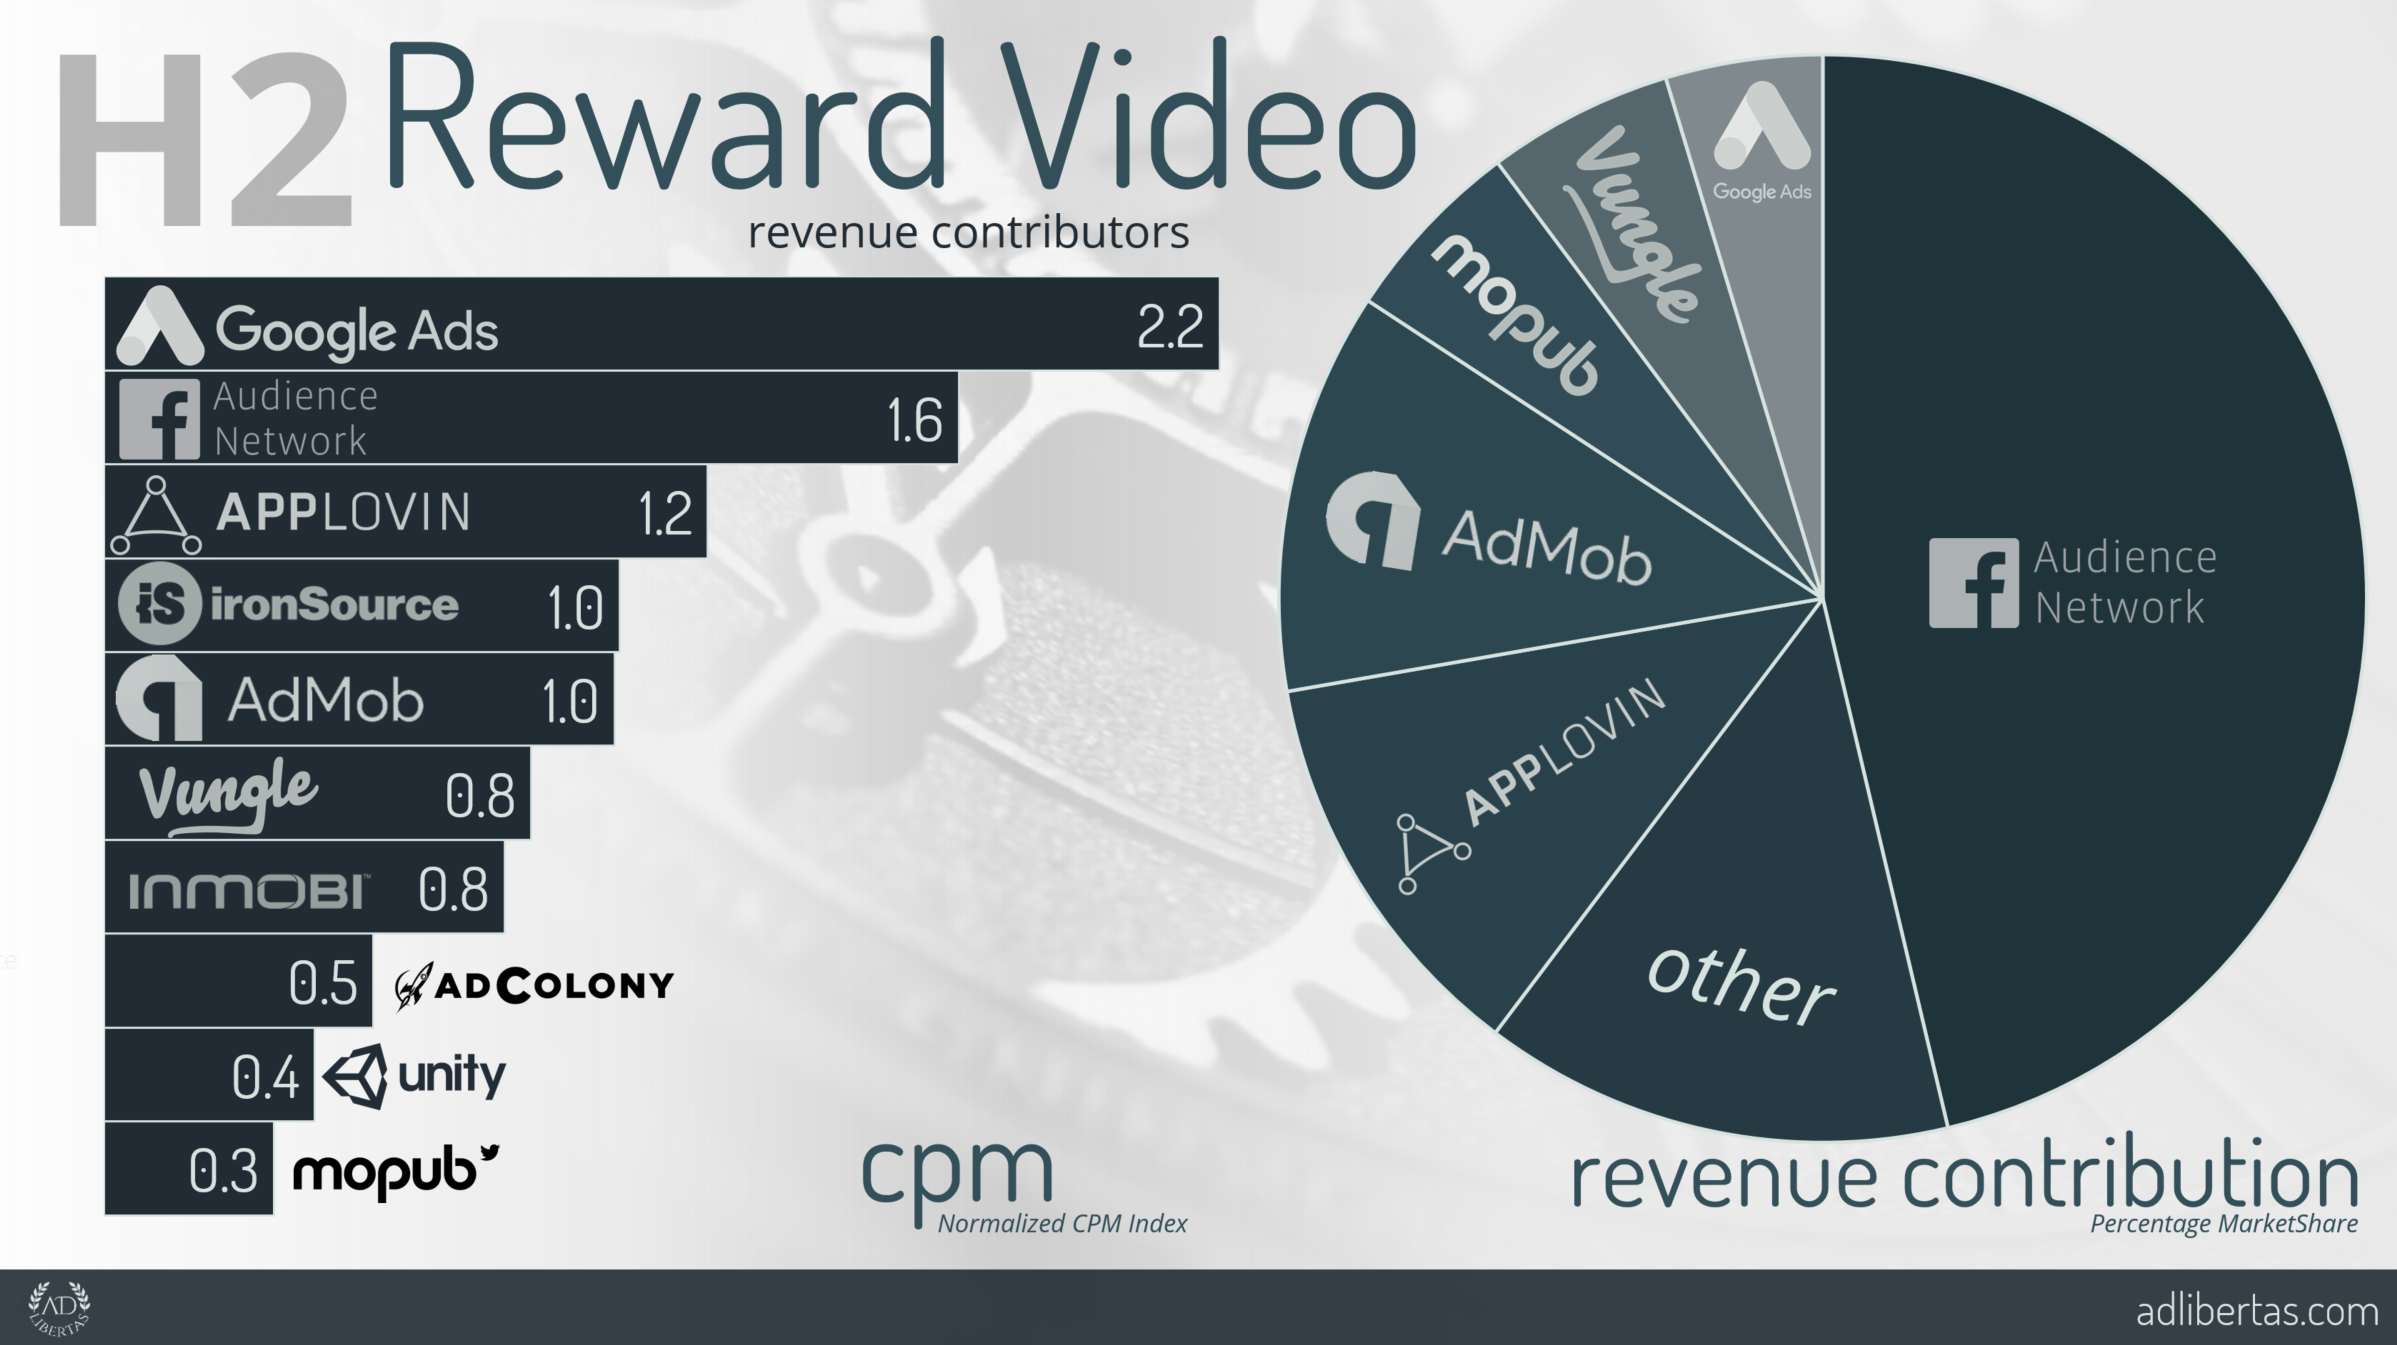
Note CPM is based on a normalized index where the value is a multiple of the entire CPM average.
Reward Video Regional Breakdown
Highlight map for details
Notes:
- Ad-unit sizes are based on MoPub’s definition.
- “Fullscreen” can include static, dynamic or even video creative served in this ad-size.
- CPM are indexed against the global market average.
- Numbers are based on network-reporting: serving discrepancies are not factored.
- “English Speaking” countries are defined as Australia, New Zealand and Canada.
- “Rest of World” Rest of World represents all countries except US, UK, AU, CA & NZ- While this doesn’t mean publishers treat these countries similarly for optimization, often higher performing networks in these regions will perform similarly in many regions.