Establishing a source of truth across multiple data sources
Anyone who works with data on a regular basis has likely come across this scenario: you’re looking at app performance metrics in two different places and they aren’t lining up. It doesn’t matter if you’re looking at installs, impressions, active users, or purchases, the simple truth with mobile apps is you’re going to see different counts from different sources. All too often this leads to the misleading question that constantly surrounds analytics “which one of these sources is correct?”

Courtesy, The New Yorker #DIYNewYorker
Most likely the answer is “all of them,” which admittedly isn’t useful or actionable. But consider, often the data itself isn’t incorrect, it’s just being measured differently. This won’t change the fact you need a baseline measure to make decisions, this baseline will be your source of truth. In the field of information science and technology, this is called the single source of truth (SSOT) or a single point of truth (SPOT).
In this article, we speak about how you can establish a source of truth. Don’t be overwhelmed, you don’t need a degree in data science to accomplish this, getting a source of truth simply requires you to understand how this data is measured and choosing the method that best meets your need.
Understand how your metrics are defined
The first step in establishing a source of truth is understanding how each of your metrics is defined and measured. This may seem pedantic but if you’re serious about getting the most appropriate metric, this step is necessary.
When dealing with user-level data at scale, slightly differing definitions become important and can cause drift in reporting. Unfortunately, it’s a very common occurrence. Let’s us an elementary example to start: an app install. Should it count when the users download from the store? First, opens the app? Or spends a few moments in the app? Turns out it’s way more complicated. The popular analytics platform Google Firebase measures an install as a user who’s fired a first_open event, while the Google Play Store will report on the number of unique devices who’ve installed the app. Now, this may sound similar, but consider this: a first_open event will fire every time a new user opens the app. It doesn’t have any context of app re-installs. And considering 40% of users re-install an app after deleting it, we have a prime example of how you can see install drift between two sources, two sources owned by the same parent company.
Let’s use another typical example: an active user. What defines active? Again, this isn’t always simple: sticking with Firebase, an active user is someone who fires at least one user_engagement event from the app during a day. This is a default event and while configurable, generally fires after ~5 seconds in the app. But in Google Play active users are defined as “the number of users who have your app installed on at least one device and have used the device in the past 30 days.” Again, a frustrating example of how the same parent company can have incredibly different metric definitions across two different tools.

While your metrics might be named the same, understanding the definition of each is your first step in understanding what causes drift in measurements.
Understand how metrics are measured
Once you’ve understood the defining logic that can cause conflicting measurements, you’ll next need to delve into the differences in how metrics are measured to fully understand exactly why the items aren’t lining up.
Let’s take retention as an example. First, we need to ensure we understand the varying definitions for retention — Amplitude uses three separate methods to measure retention. But often, even with the same definition, you can still see differing results based on the methods in which the metrics are calculated. Generally, when measuring retention on day 10 you count unique users that installed on day 1, then were also active on day 10.
But let’s pause on one key item often overlooked: “unique users.” How are you identifying each user? This matters, because if this changes, or resets, the number of overall unique users can change. Firebase creates and uses a pseudo_user_id. AdLibertas — and most ad platforms– use identifiers set at the device level. How are these different? Well, the Firebase ID resets on app reinstall, but the device ID doesn’t. So if a user uninstalls and re-installs the app within those 10 days, the AdLibertas retention curve will include them – the Firebase retention measurement will not. So apps with noticeable re-install rates can see a drift in retention because of different unique user IDs.
This isn’t hyperbole. We have a number of clients that have very high reinstall rates – which causes drift on how they measure retention. And while this is a simplified description, it is nonetheless a very real example of how—at scale – numbers can drift even with the exact definition.
Much like ad impression discrepancies, there will always be “standard discrepancies” among data sources, the IAB published a paper showing 5-50% data discrepancies on mobile. Now 5% is manageable but 50% is likely untenable to be considered reliable. These drifts will be more pronounced if you have non-standard or problematic user activity. In way of example, we have a customer that buys large amounts of low-cost users via preload campaigns. A preloaded app comes with a new phone, in this case, many of the new users delete the app with little to no engagement. In this scenario, it created a large number of users that opened the app (tripping a first_open event), but didn’t stay in the app long enough to measure as an active user (fire an engagement_event). As a result, they see large amounts of install drift between install numbers as one of their products measures first_open and another measures user_engagement.

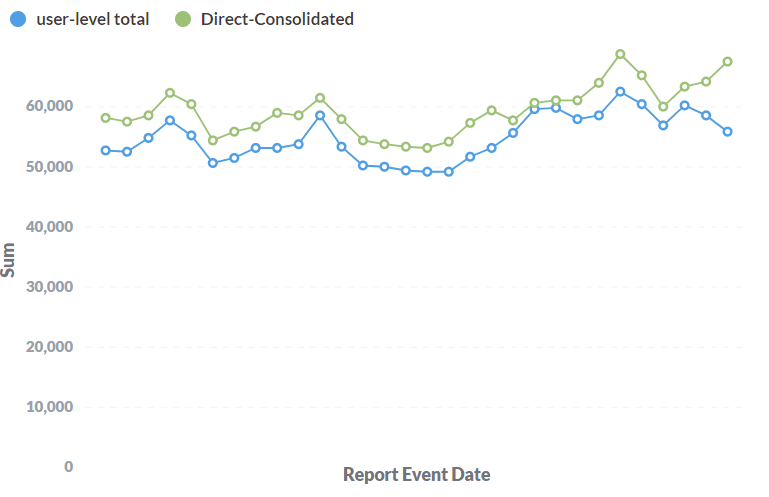
A fairly typical representation of data drift, in this case, we have impressions measured at the aggregate level (revenue reporting) vs. user-level impressions. In this case, both numbers are being reported by the same source (SSP).
Tying it all together
In most cases you will face a discrepancy among data sources, but here’s a tip: provided it’s consistent for most purposes, it doesn’t really matter. Consider, for most purposes, you’re using these data sources to either measure change over time or compare against benchmarks to drive actions. If you’re using the same consistent metric it won’t matter if your DAU is inflated by a reliable 10%, provided you can see the change as it relates to previous performance or against other benchmarks.
Often the challenge isn’t choosing the “correct” source of truth but rather, maintaining that source consistently across all of your KPIs. The real challenge is to get a comprehensive view into all angles of your data after centralizing your data in a single “metric,” instead of falling back to “good enough” where your measurements are blind or can’t be tied together.
For instance, let’s continue with Firebase analytics as your “source of truth.” As we explored earlier, Firebase uses a proprietary ID, unique to the Firebase SDK to track individual users. This will provide you retention, DAU, and other engagement KPIs, however, if your goal is to track revenue per user– or LTV per user– you’ll need the ability to tie user-revenue—as reported by your ad monetization platform or your IAP system—back to the Firebase events. This revenue is reported by third parties, who have no concept of the Firebase pseudo_id, therefore information regarding revenue can’t easily be associated with individual users using this ID.
So you’re left with a challenge: ignore revenue or use another method for tracking users. All too often, when users are presented with incomplete or incompatible datasets they simply estimate or outright ignore the other datasets. We think this mentality is wrong. At AdLibertas, our goal is to tie ALL data sources together to increase the quality and efficacy of your analysis. We prefer using system-level IDs to act as the “primary key” for connecting user information together.

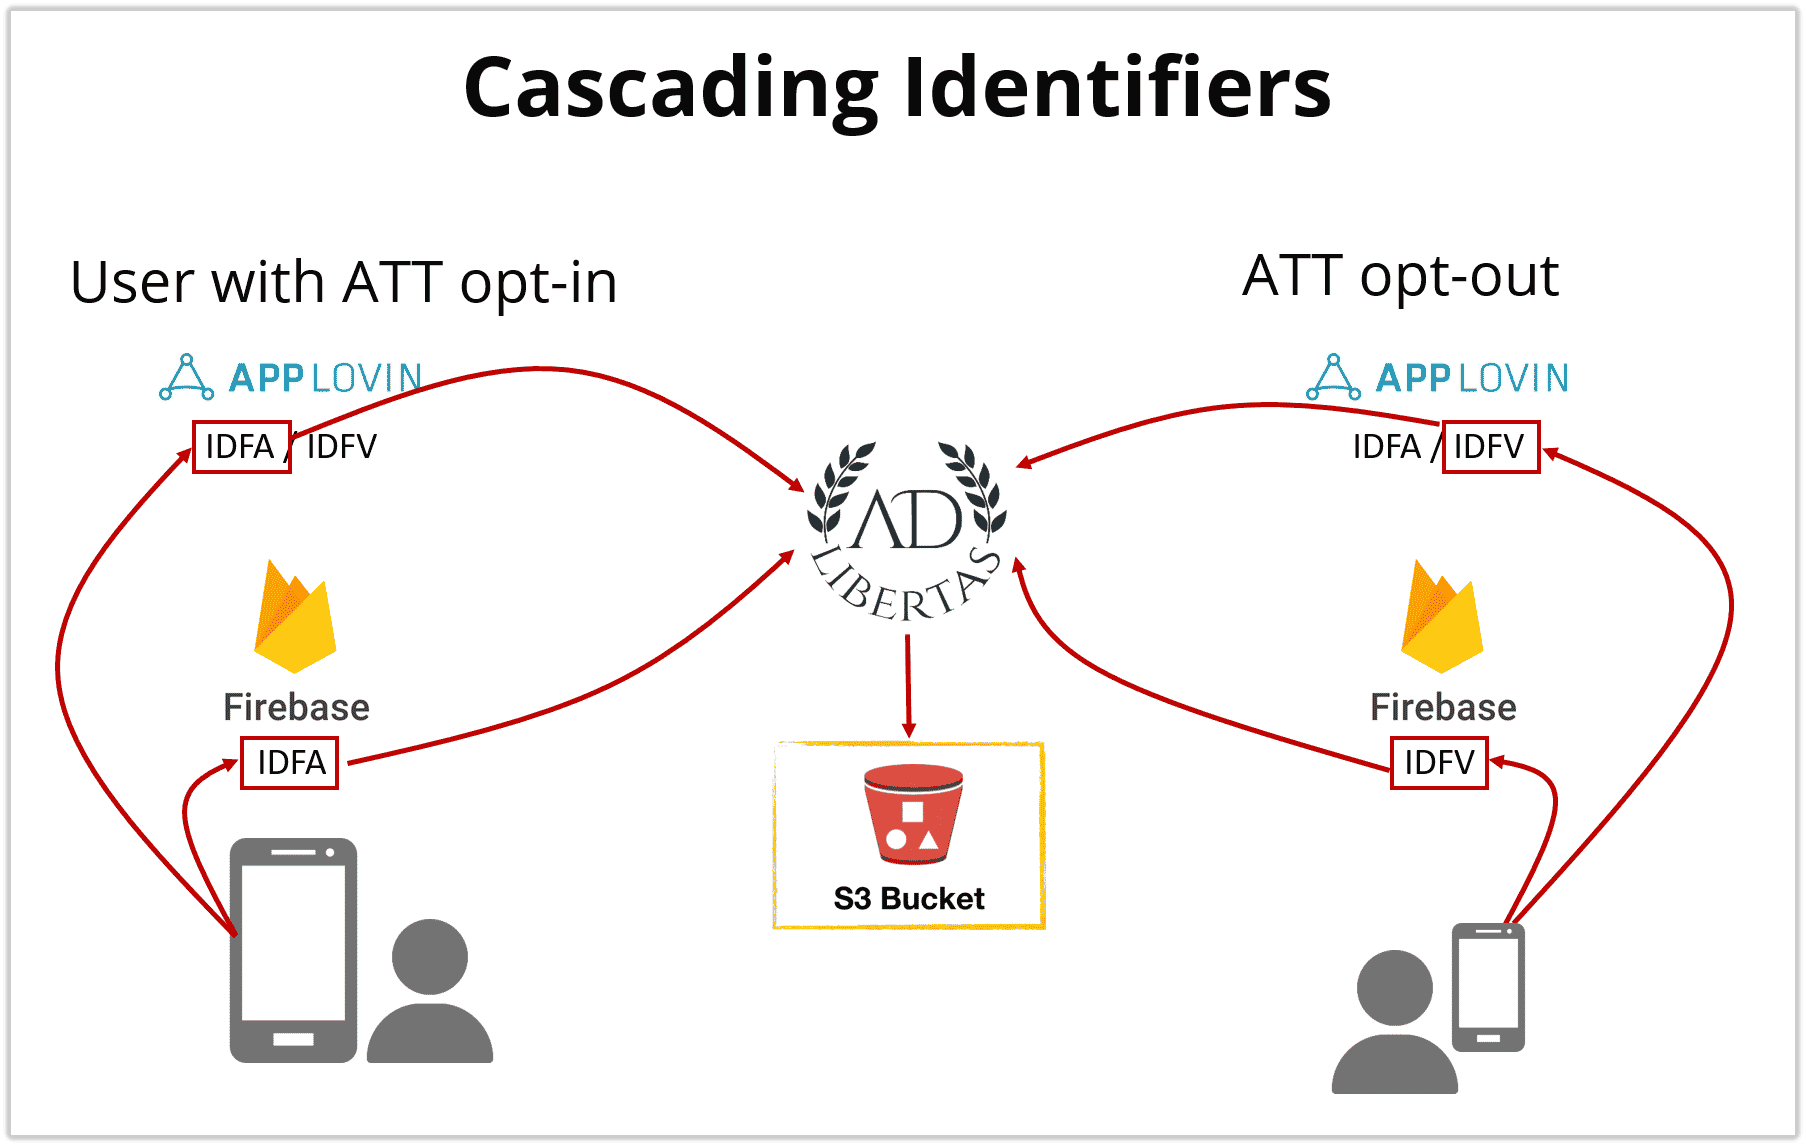
Making matters even more difficult, often user IDs aren’t consistently available across data sources. We’ve had to develop a cascading method for user attribution.
A challenge we face in choosing a single key is it simply isn’t available in some places. In our case – for IOS – we use the IDFV, which is generally available, or at least optionally available by most data sources. Except where it isn’t. Firebase returns the IDFV only when the IDFA isn’t available (source). As a result, we use a cascading hierarchy of identifiers for user identification.
Your data is a tool. Used incorrectly it can be ineffective at best, and dangerous at worst. Tying multiple data sources together may seem difficult, time-consuming, and expensive and in truth, it is. However, only after having undergone the investment of doing so yourself – or using a vendor to help — will you be able to get a complete view of your user-level behavior and the impact behind user actions.
This complete, holistic view of your user behavior will allow you to move beyond questioning the value of your data and move to take action on the findings you uncover.
For real-world examples of what mobile app developers are doing with holistic views of user behavior see some of our case studies below, or get in touch!


