Market Update: Ad Network Performance (YTD)
Market Update: Ad Network Performance (YTD)
Foreward:
In our previous recent articles we covered macro trends for in-app advertising as well as supplying pointers to app developers during uncertain times. Today we will cover specific ad network performance year-to-date as it relates to ad-types in the efforts to help app developers both see how they compare against the industry averages, as well as make proper choices for the future.
Previous Reading:
- March 26th: Market Forces & Trends During a Period of Volatility
- April 6th: VentureBeat: App developers in post-Covid world: A bleak future, rife with opportunity
- April 9th: VentureBeat follow-up: specific opportunities in a down-market
Banners: 2020 YTD
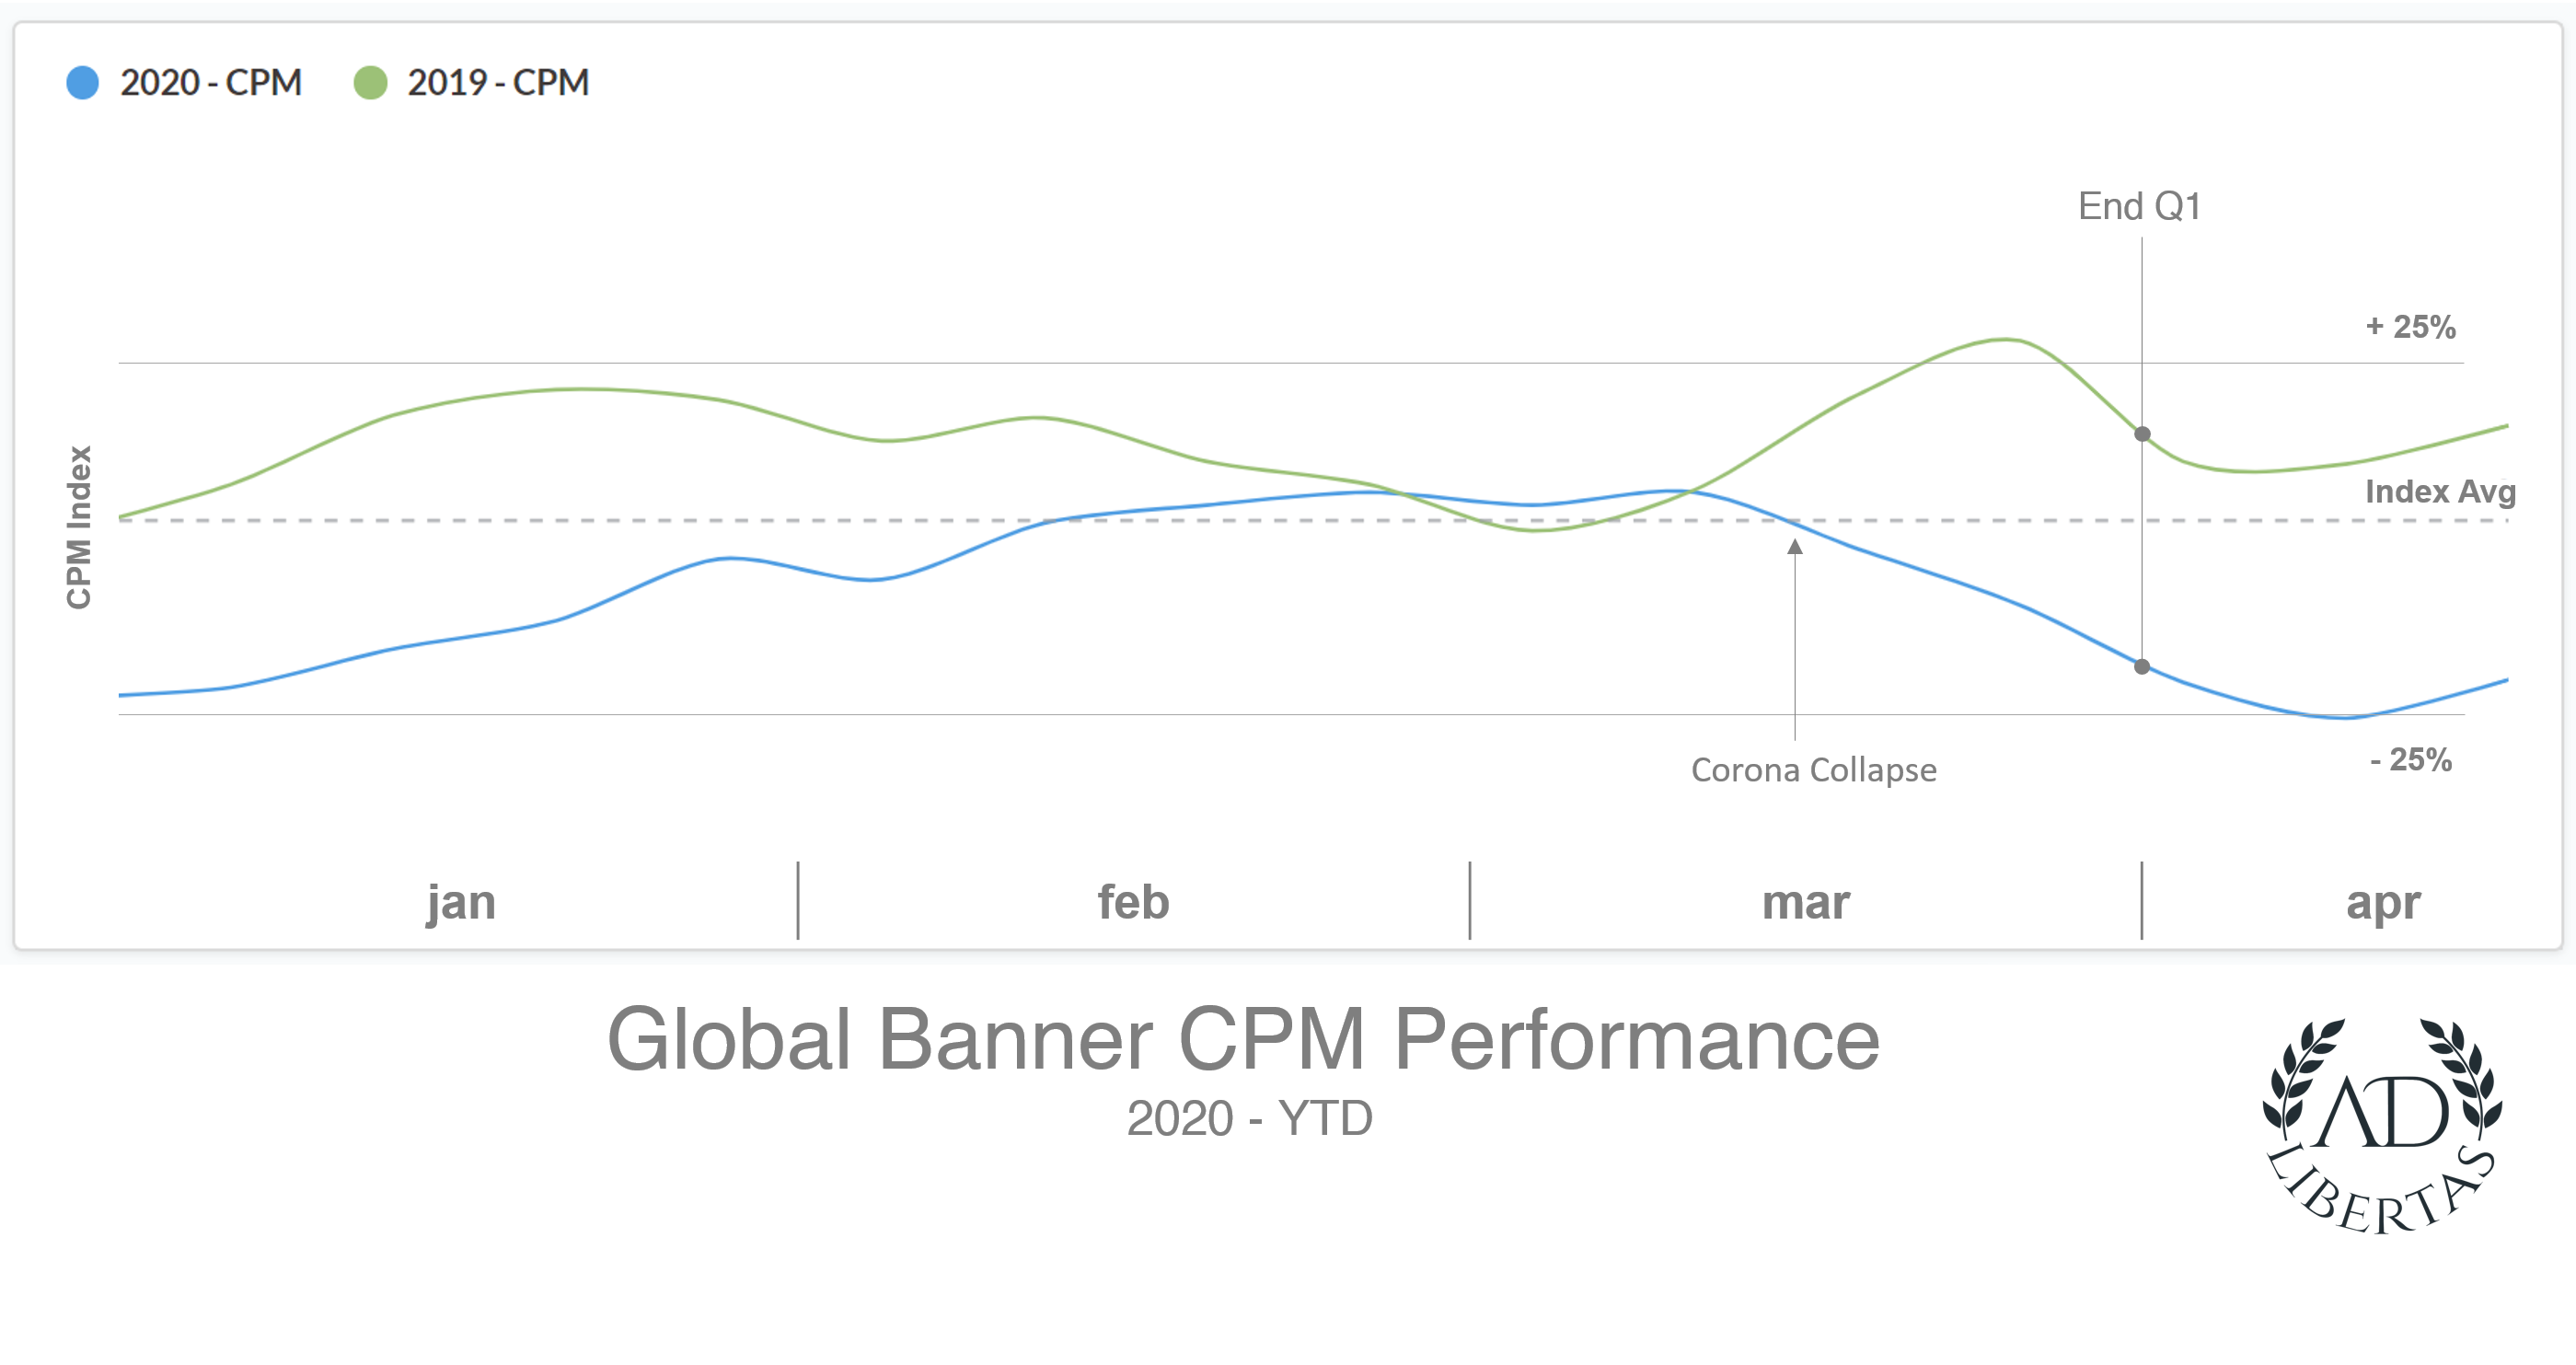
Banner CPM Analysis (by week)
- 2019 started out with typical CPM drops, ran flat then saw a +25% surge in the last 2 weeks of the quarter.
- 2020 started softer (-25% off the CPM indexed average), and while looking to make a recovery for end of the quarter they leveled off in early March.
- On the day of the Dow Index dropped 3,000 points (March 16th, 2020) banner CPM rates in dropped off a cliff.
- Rates have continued to fall through the beginning of Q2, touching -25% off the indexed average.
click images for full resolution
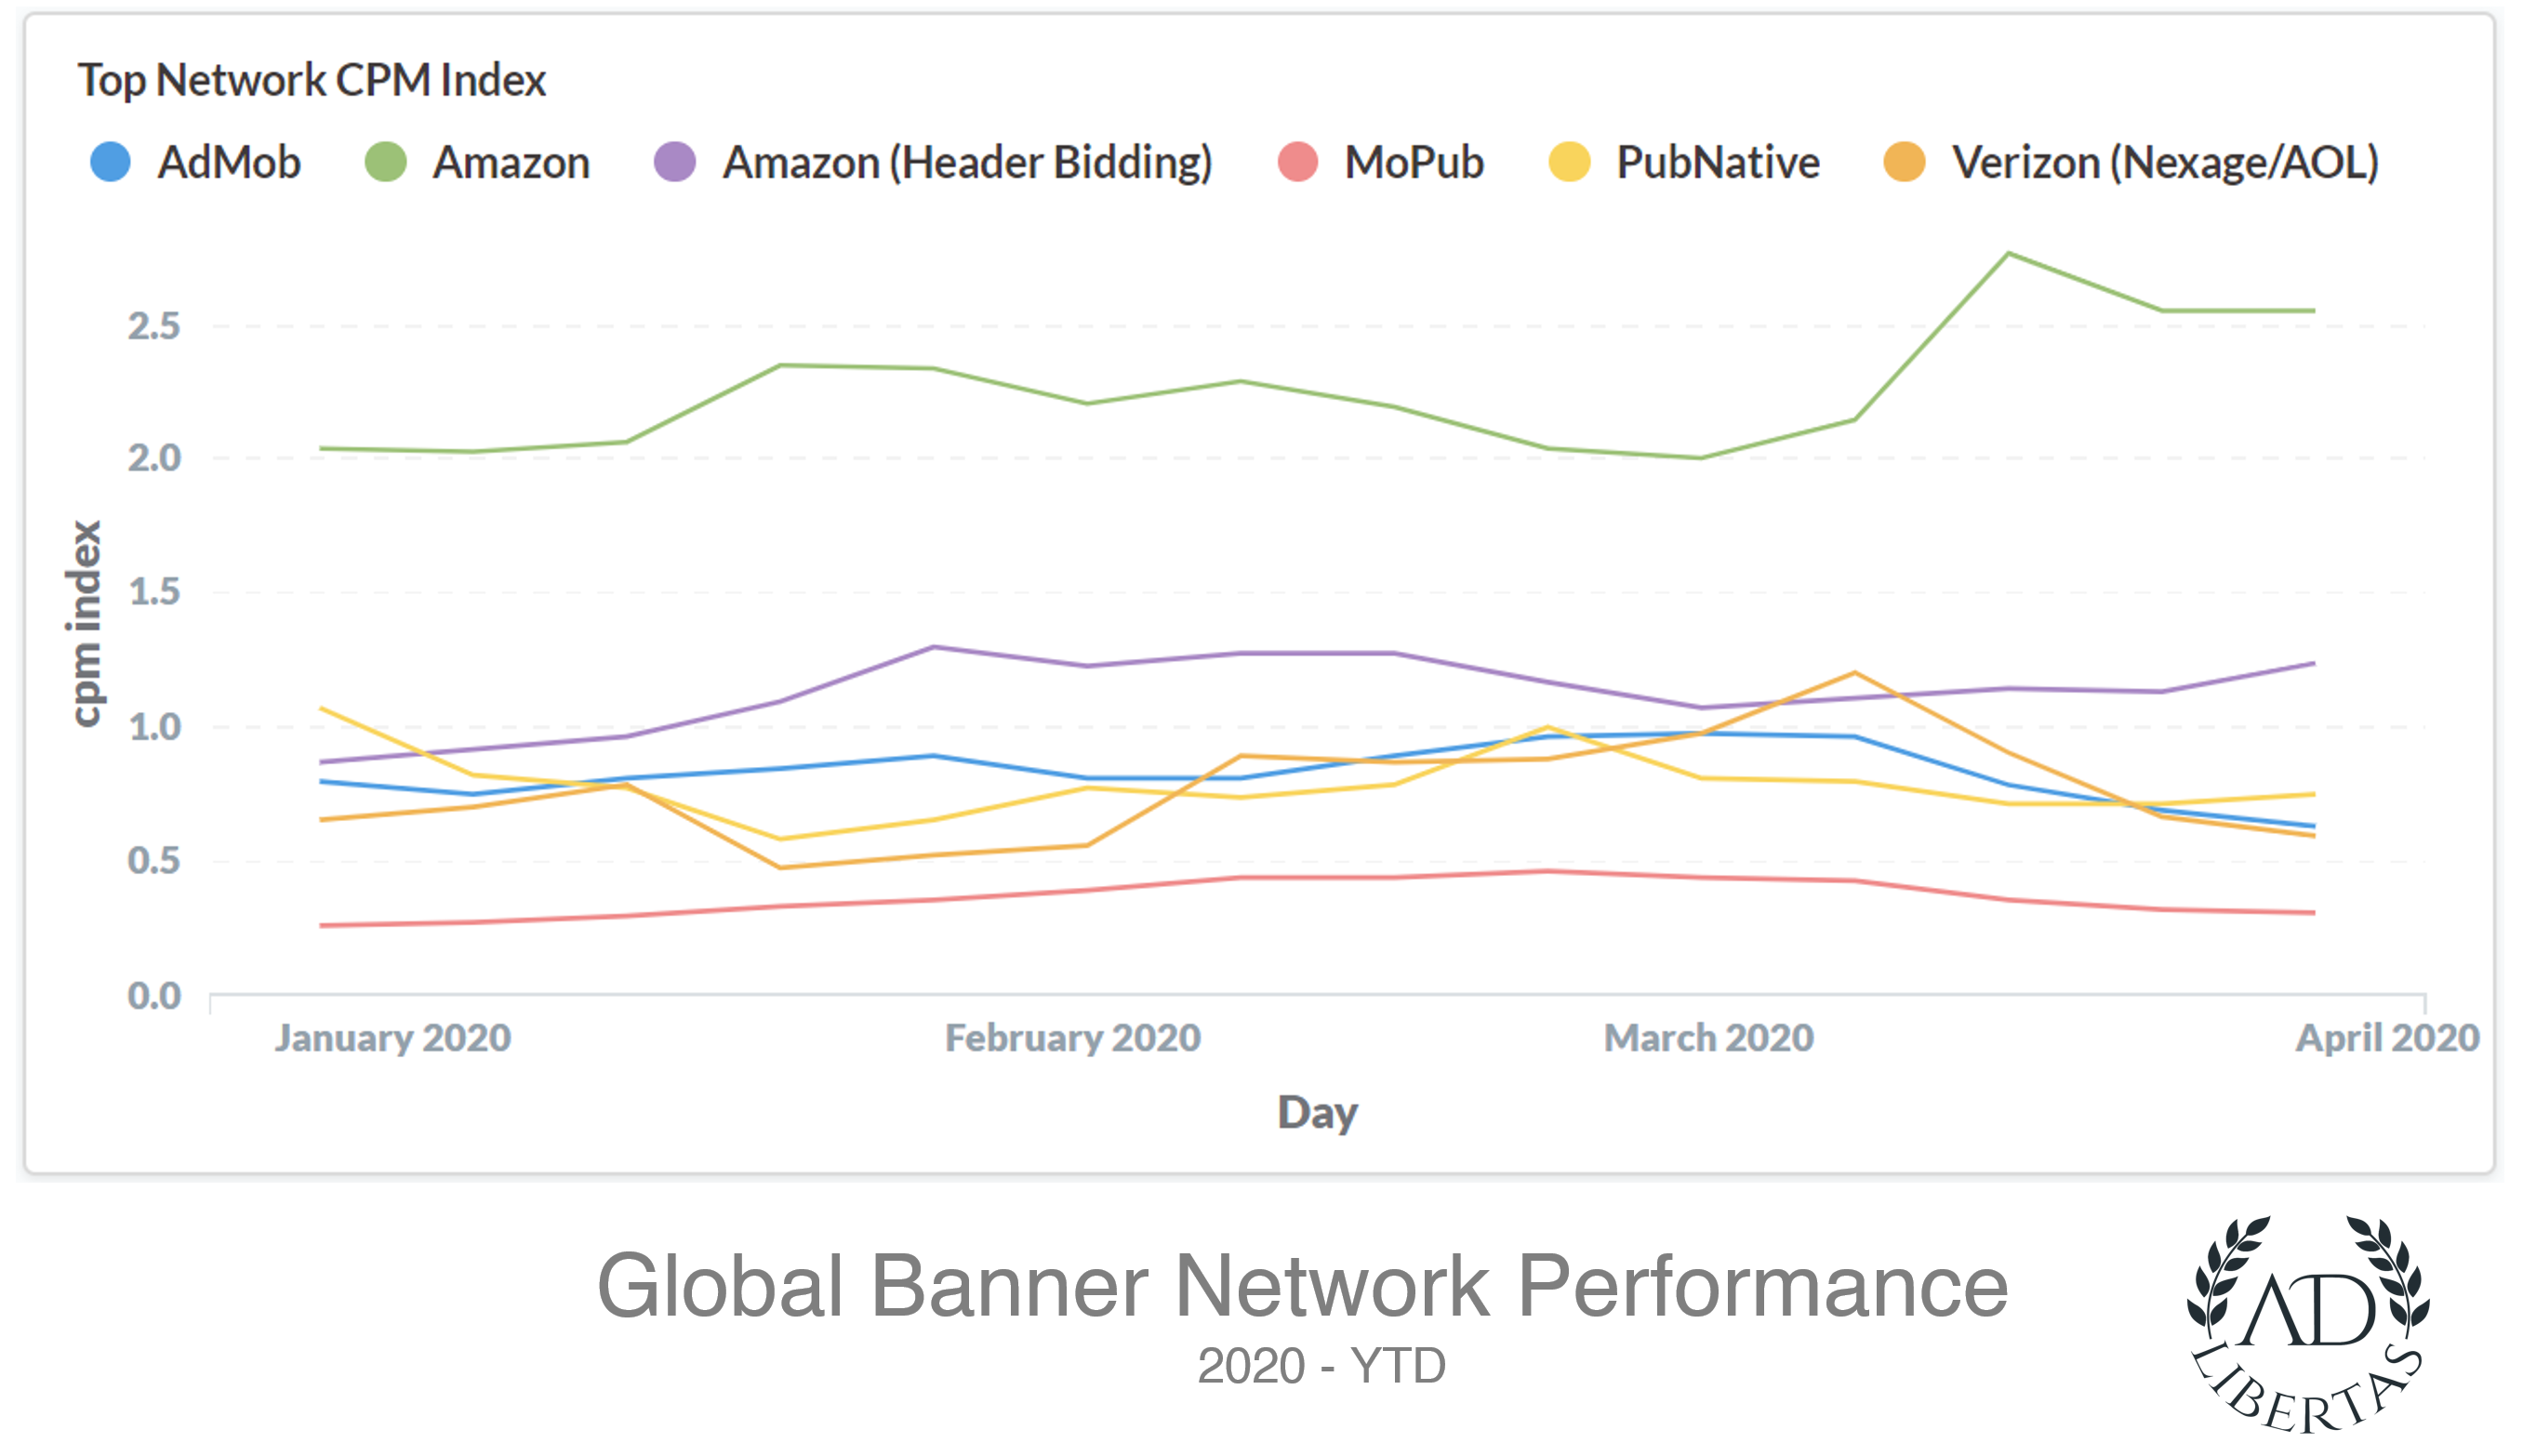
Network Banner Performance:
- The stand-out network is Amazon whose already high average rates jumped as demand for their services surged. They’ve maintained this premium to-date.
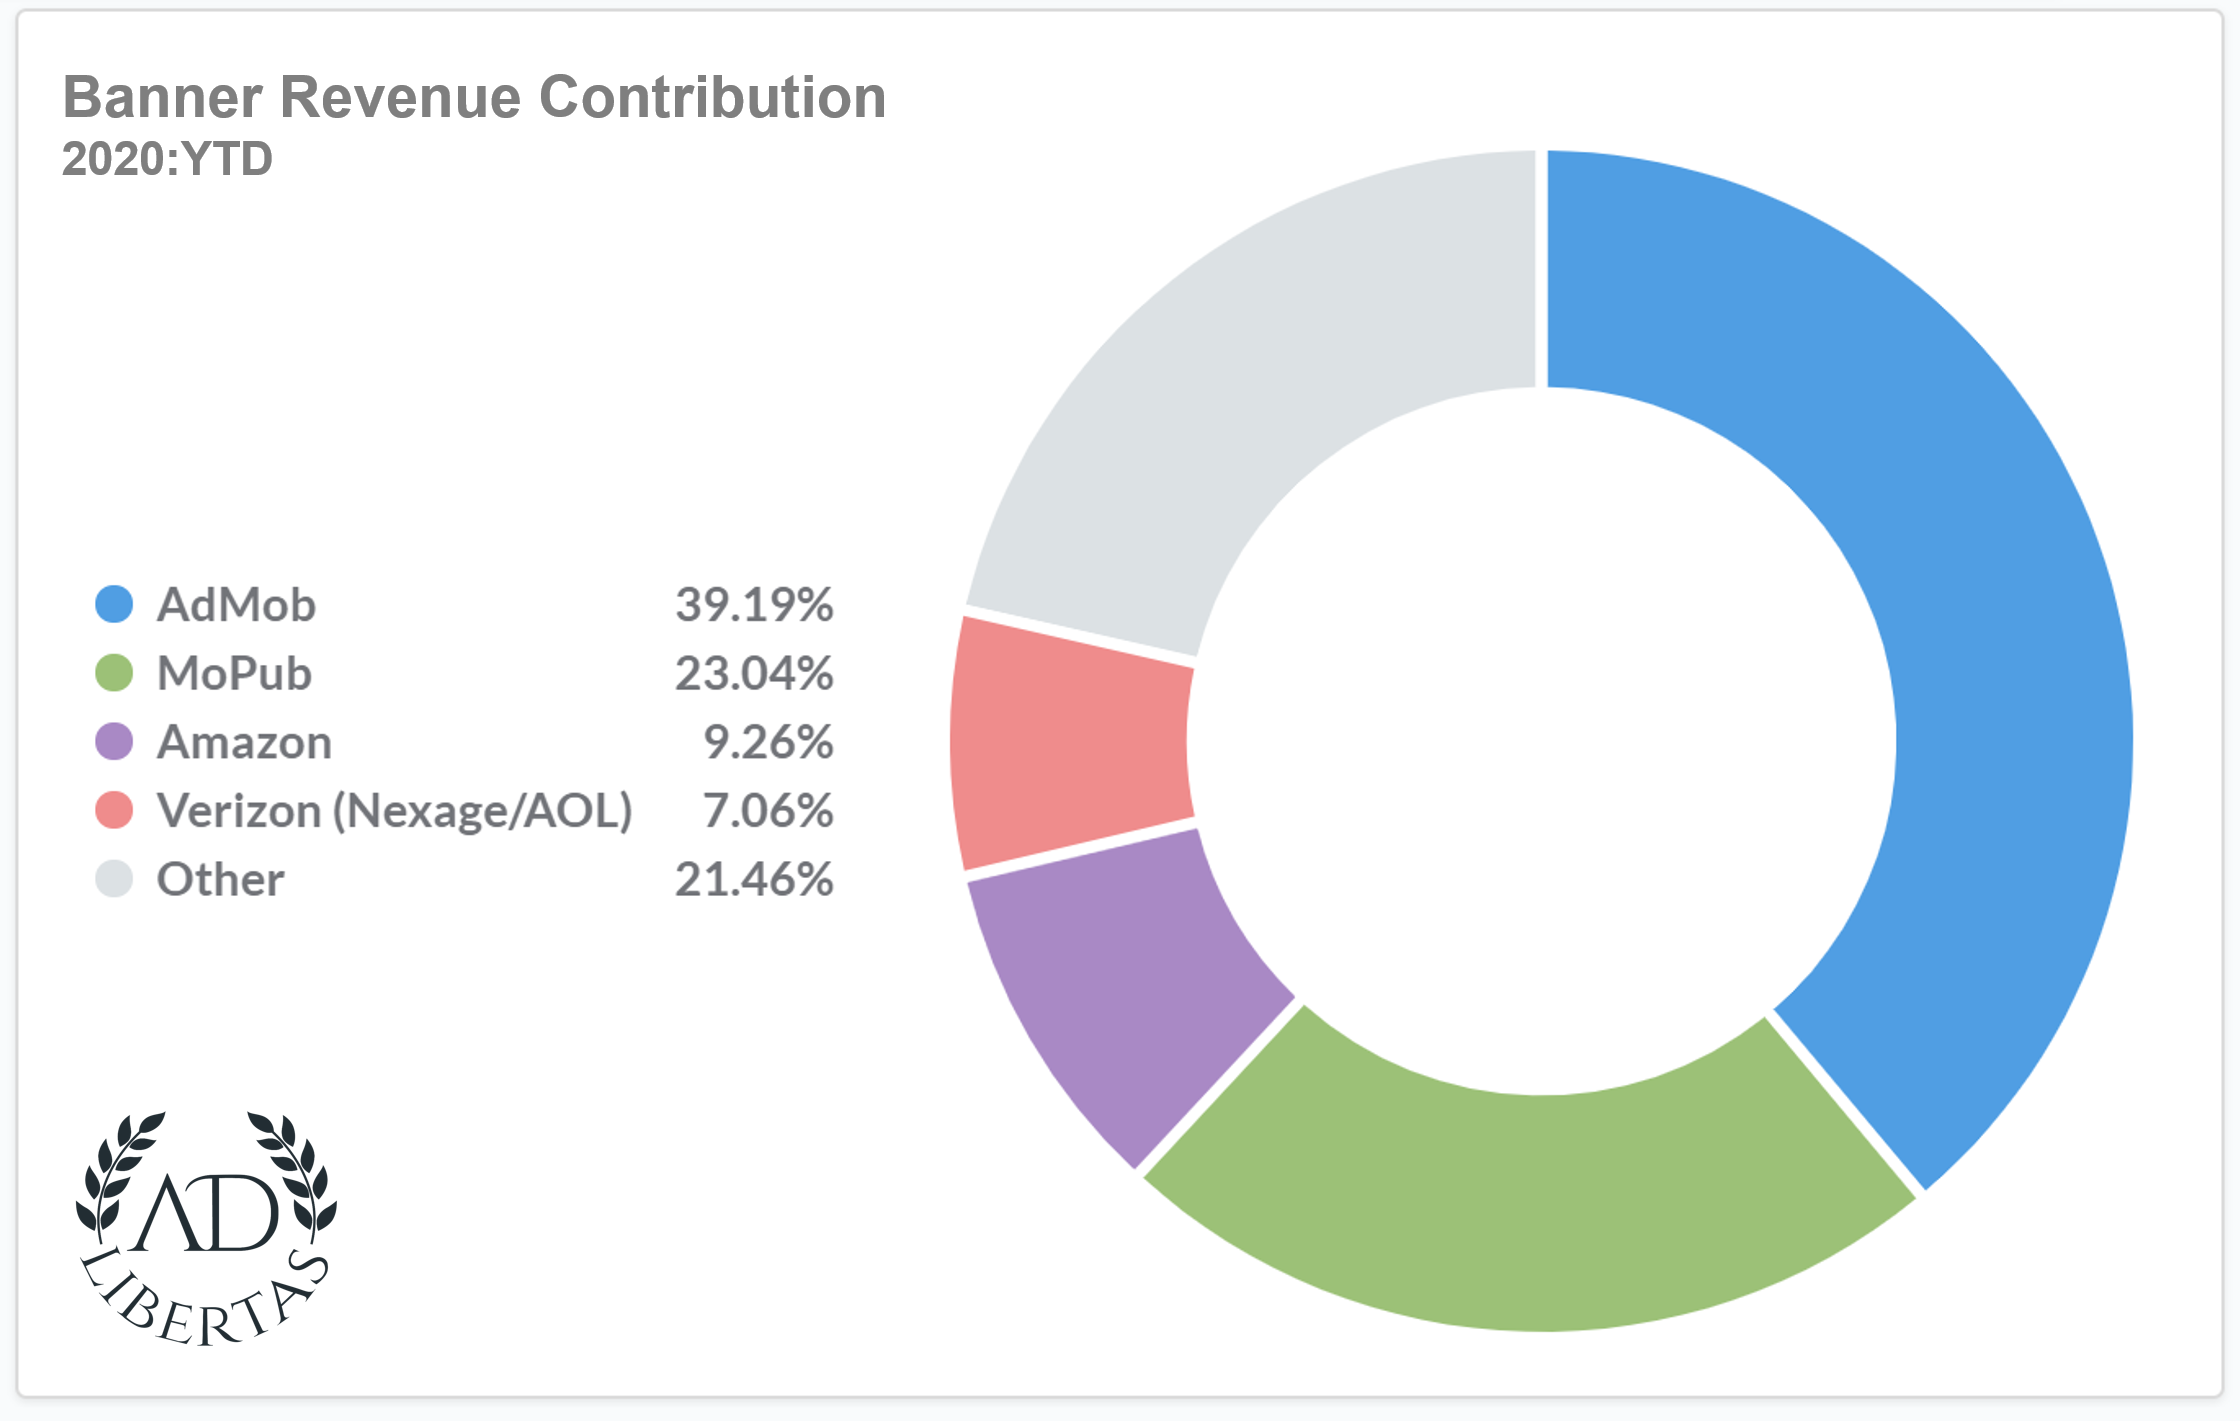
- Compared to Amazon the other network performance may look flat, but keep in mind 60% of banner revenue is concentrated between MoPub & Admob.
- Both of the banner giants were adversely affected, Admob is off March highs by -35%, MoPub’s CPMs are down -38%.
Banner Summary: banner CPM performance is down ~30% globally.
Full Screen: 2020 YTD
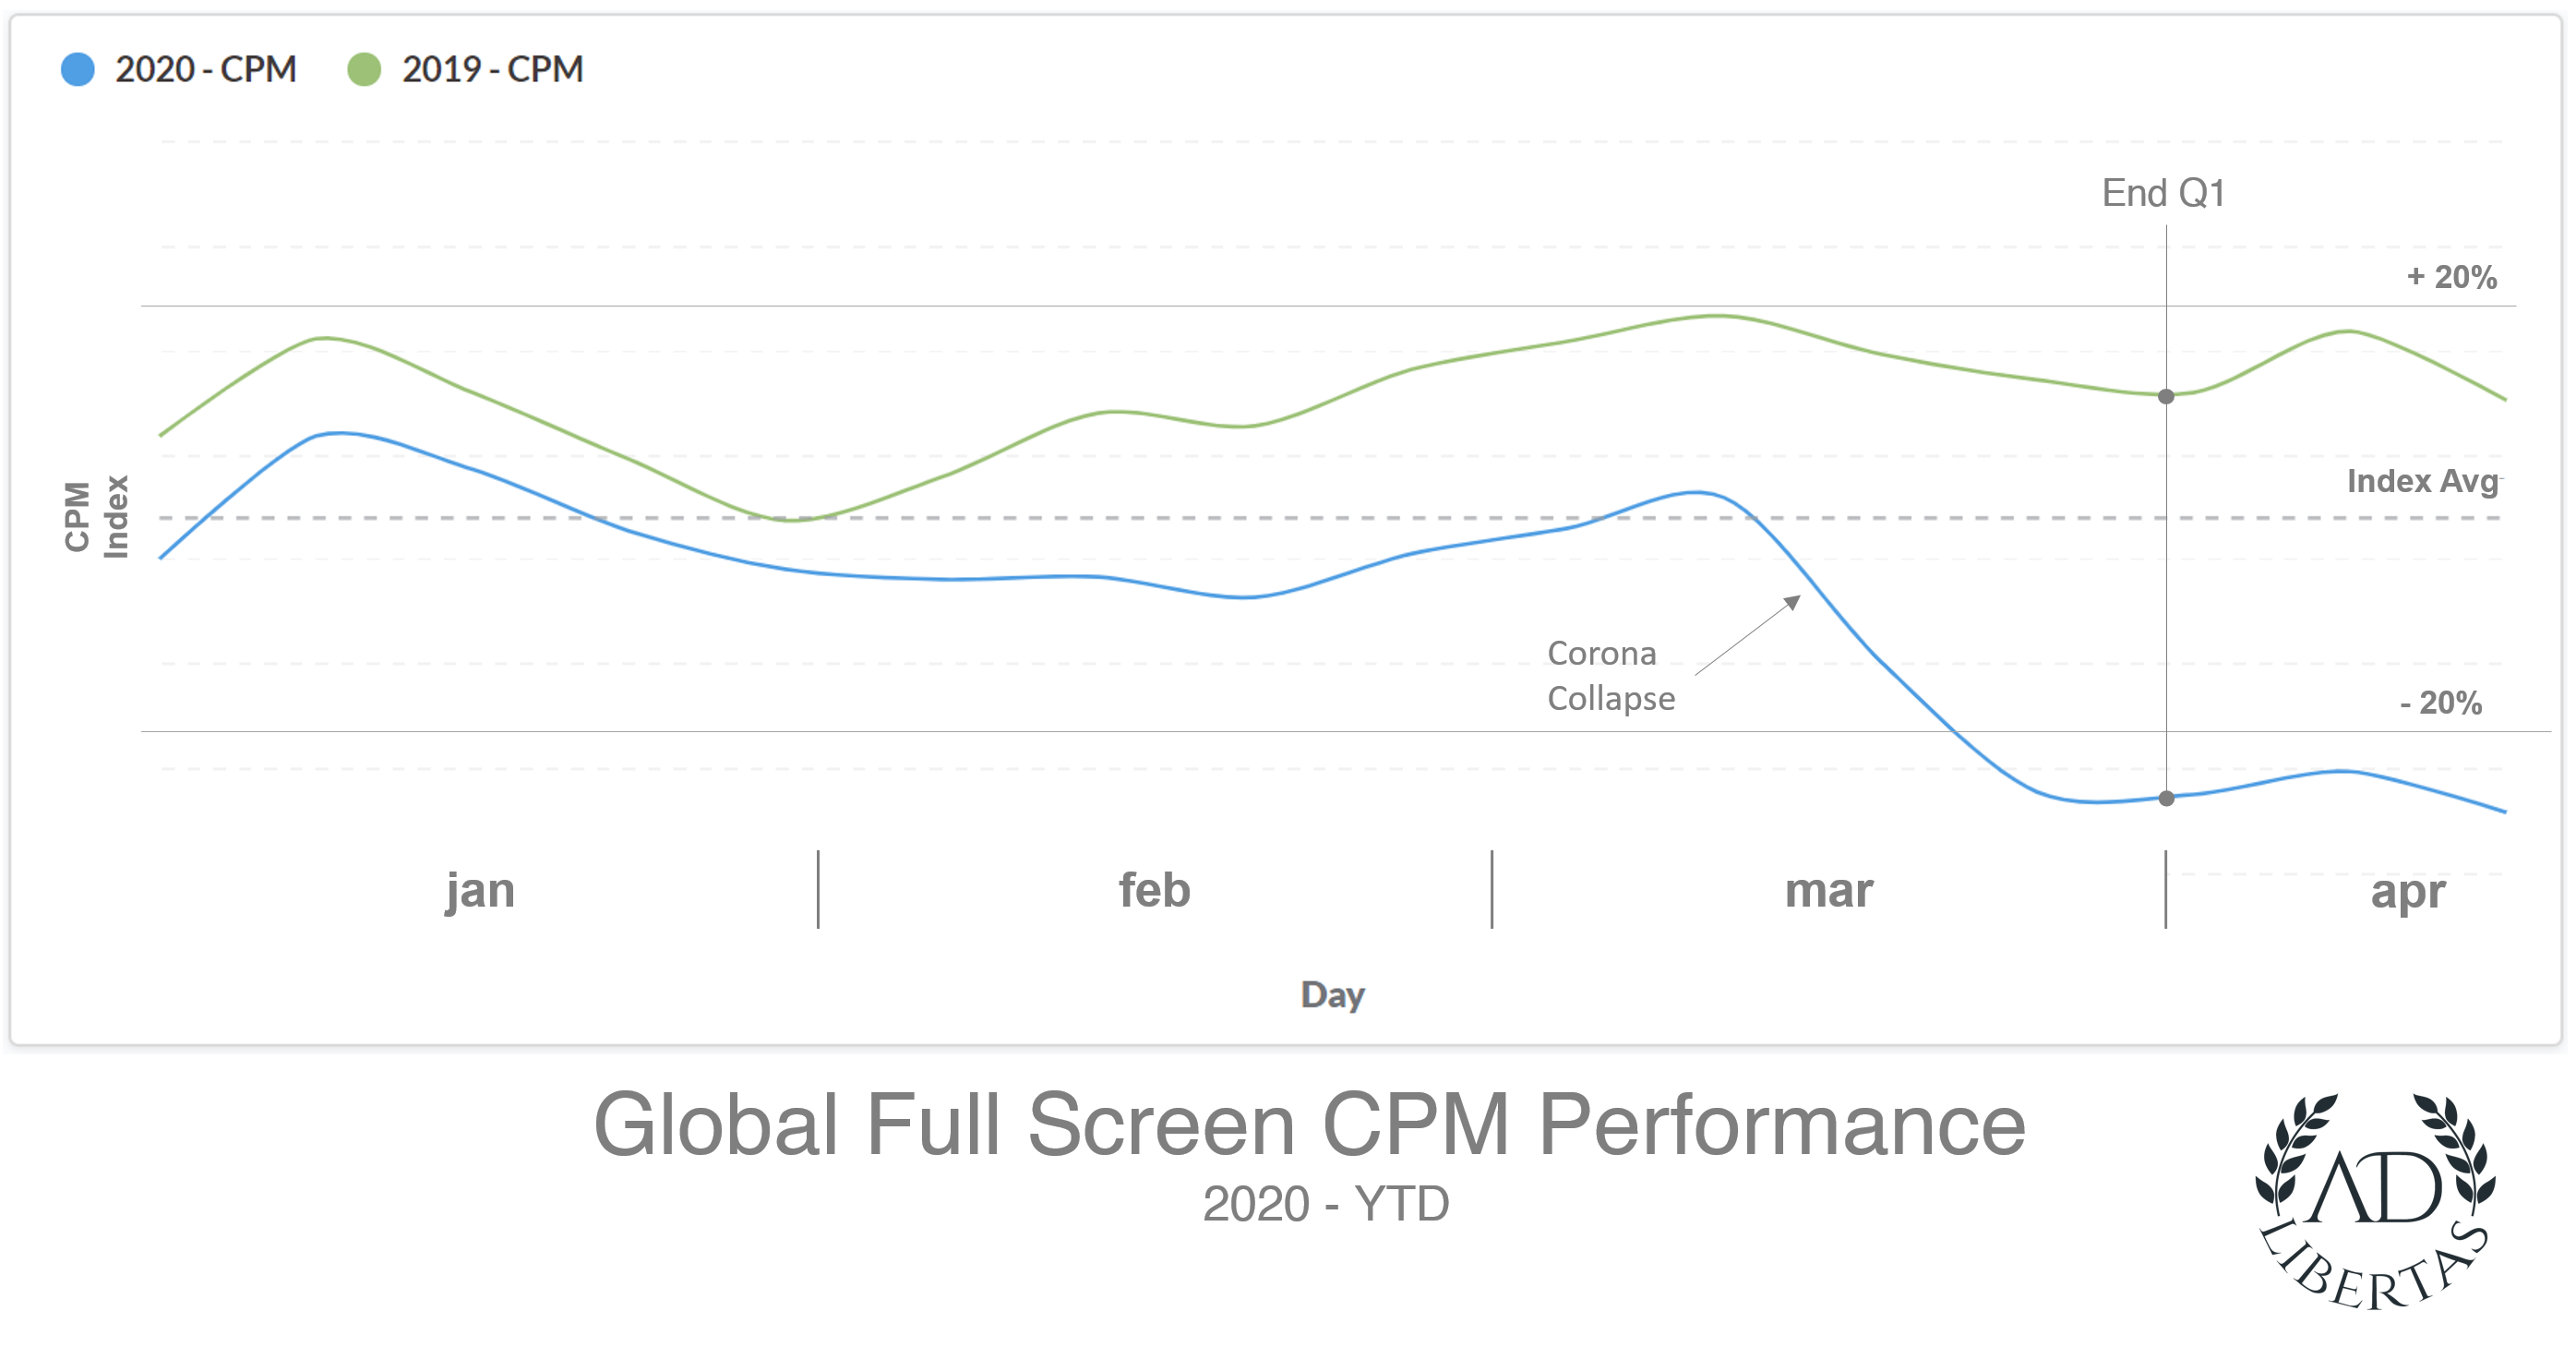
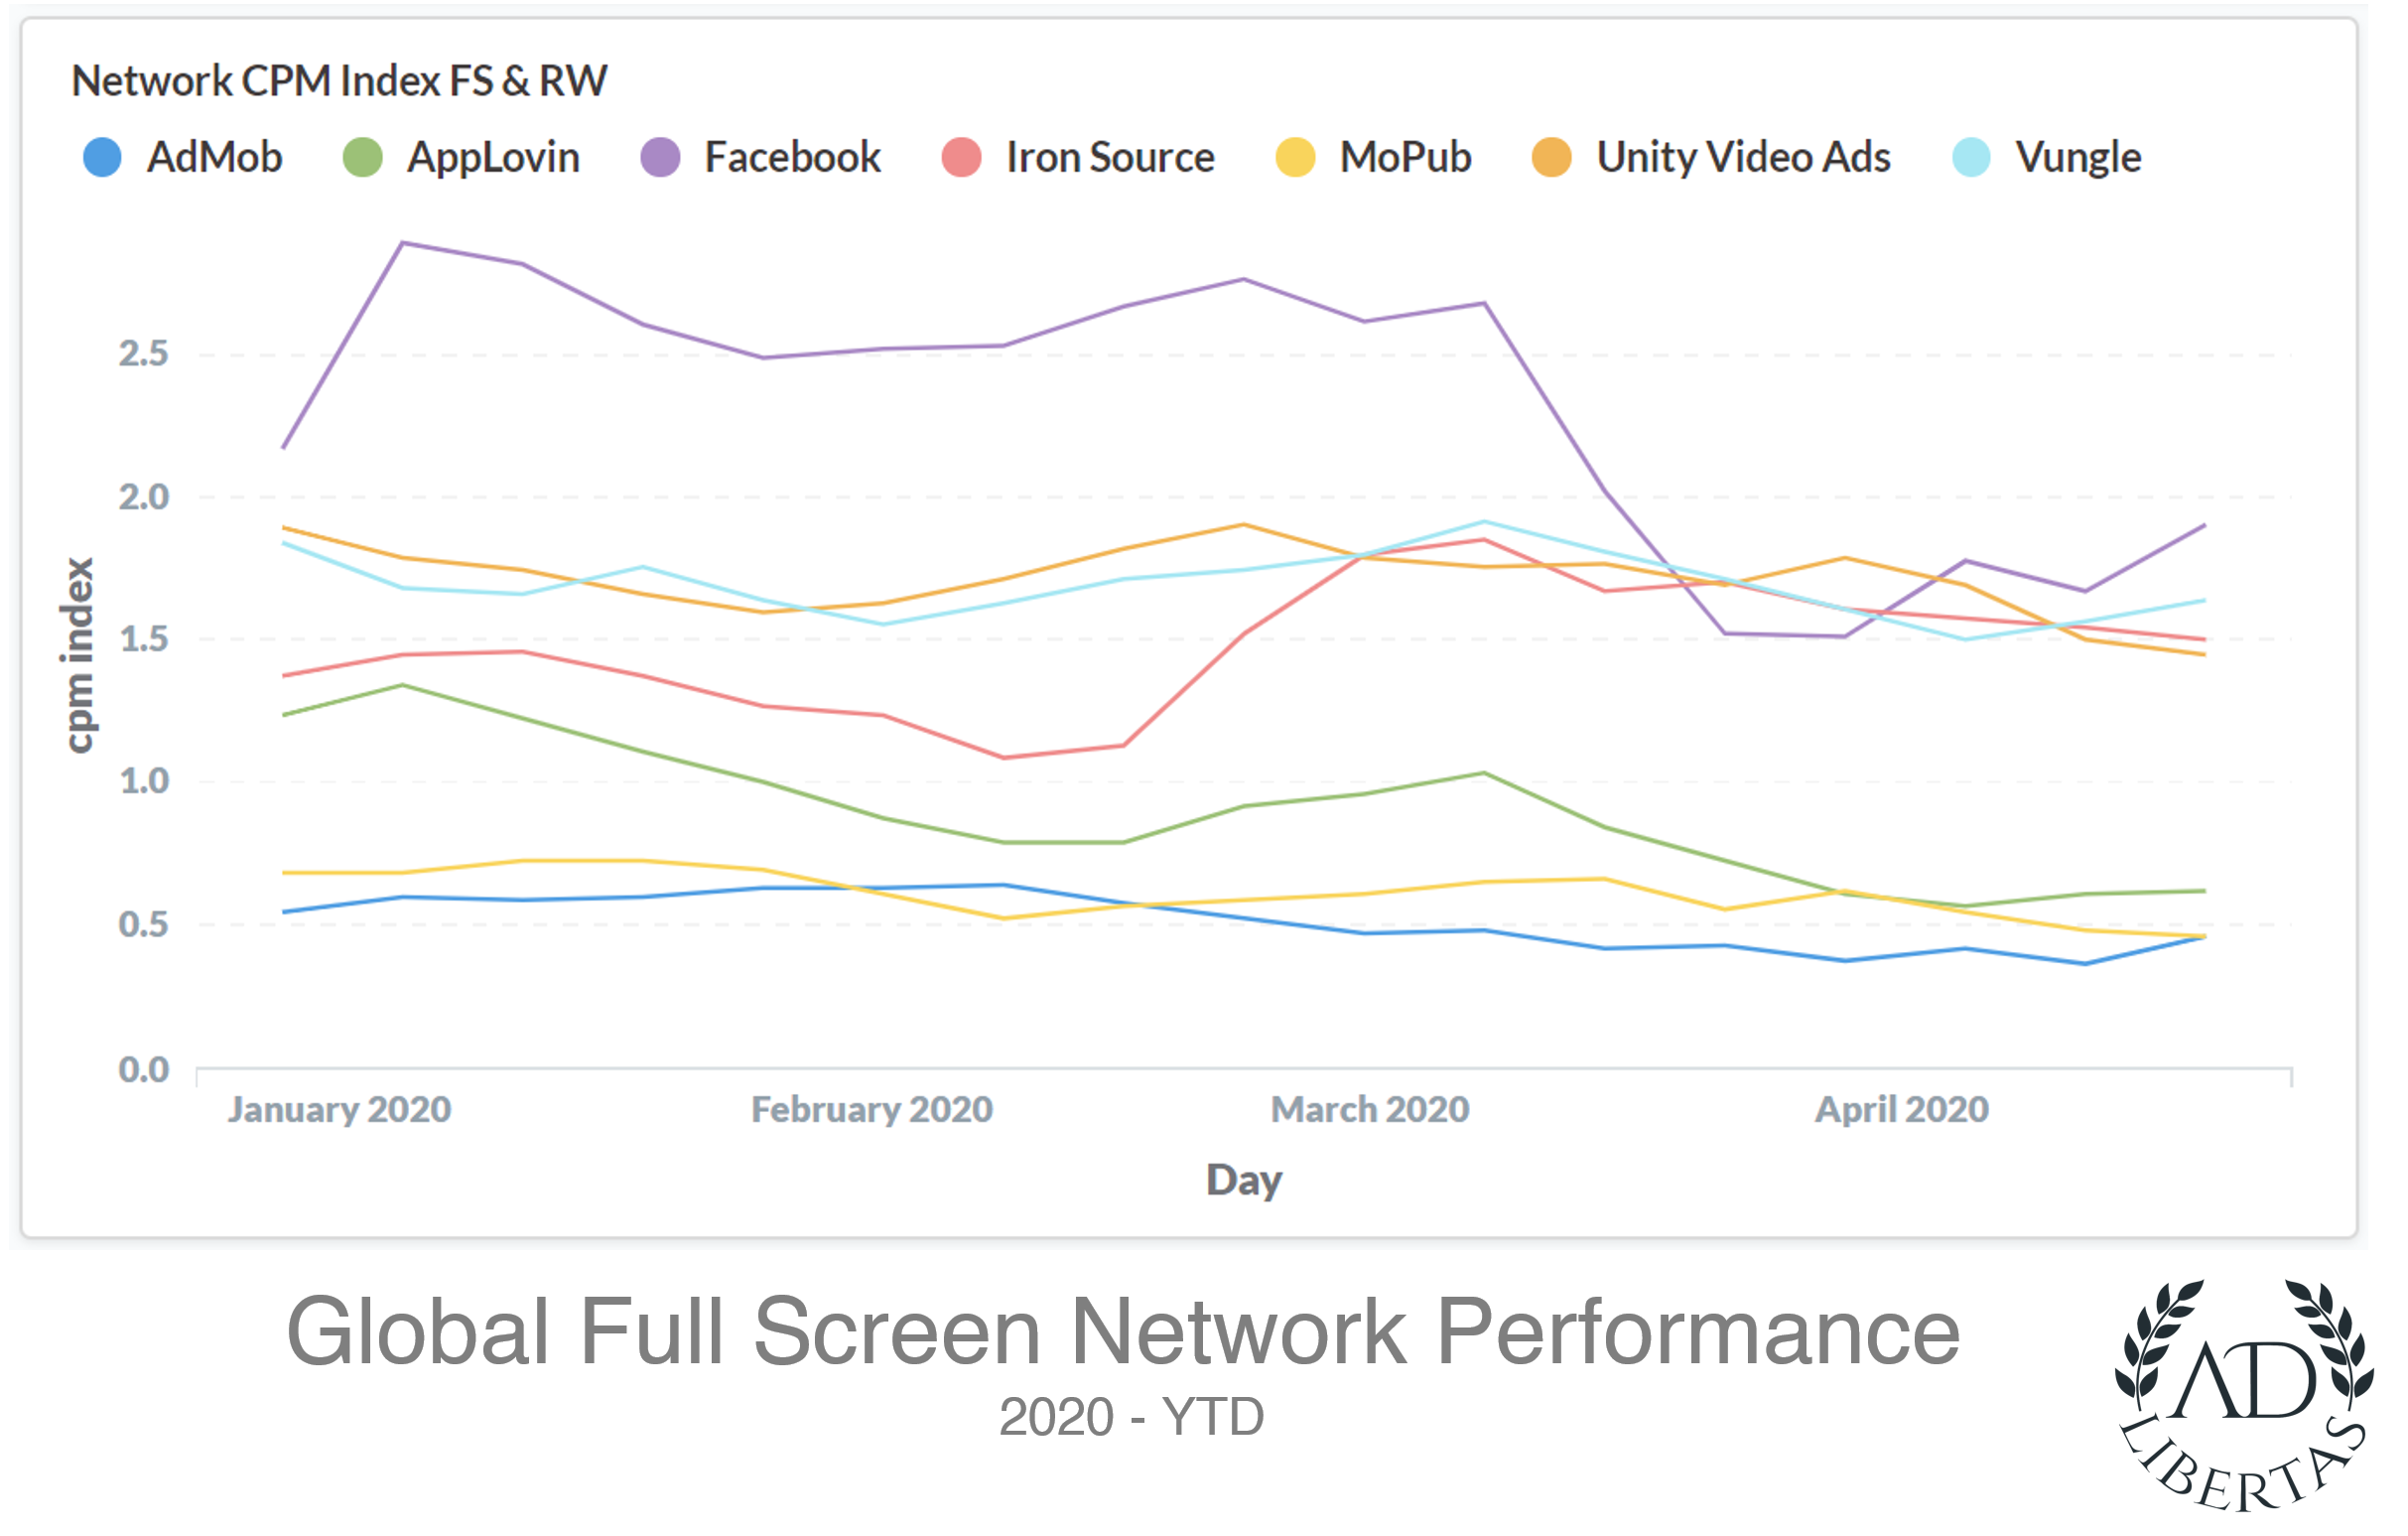
Full Screen & Reward Video CPM Analysis (by week)
- Historically full screen inventory — dominated by performance buyers– sees less quarter-end peaks than the more brand-heavy banner inventory.
- 2019 & 2020 saw similar growth trajectories, until the date of the March 16th
- Post 3/16/20 the market saw an immediate performance drop below ~25% of the indexed average
- These lowered rates have maintained to-date.
click images for full resolution
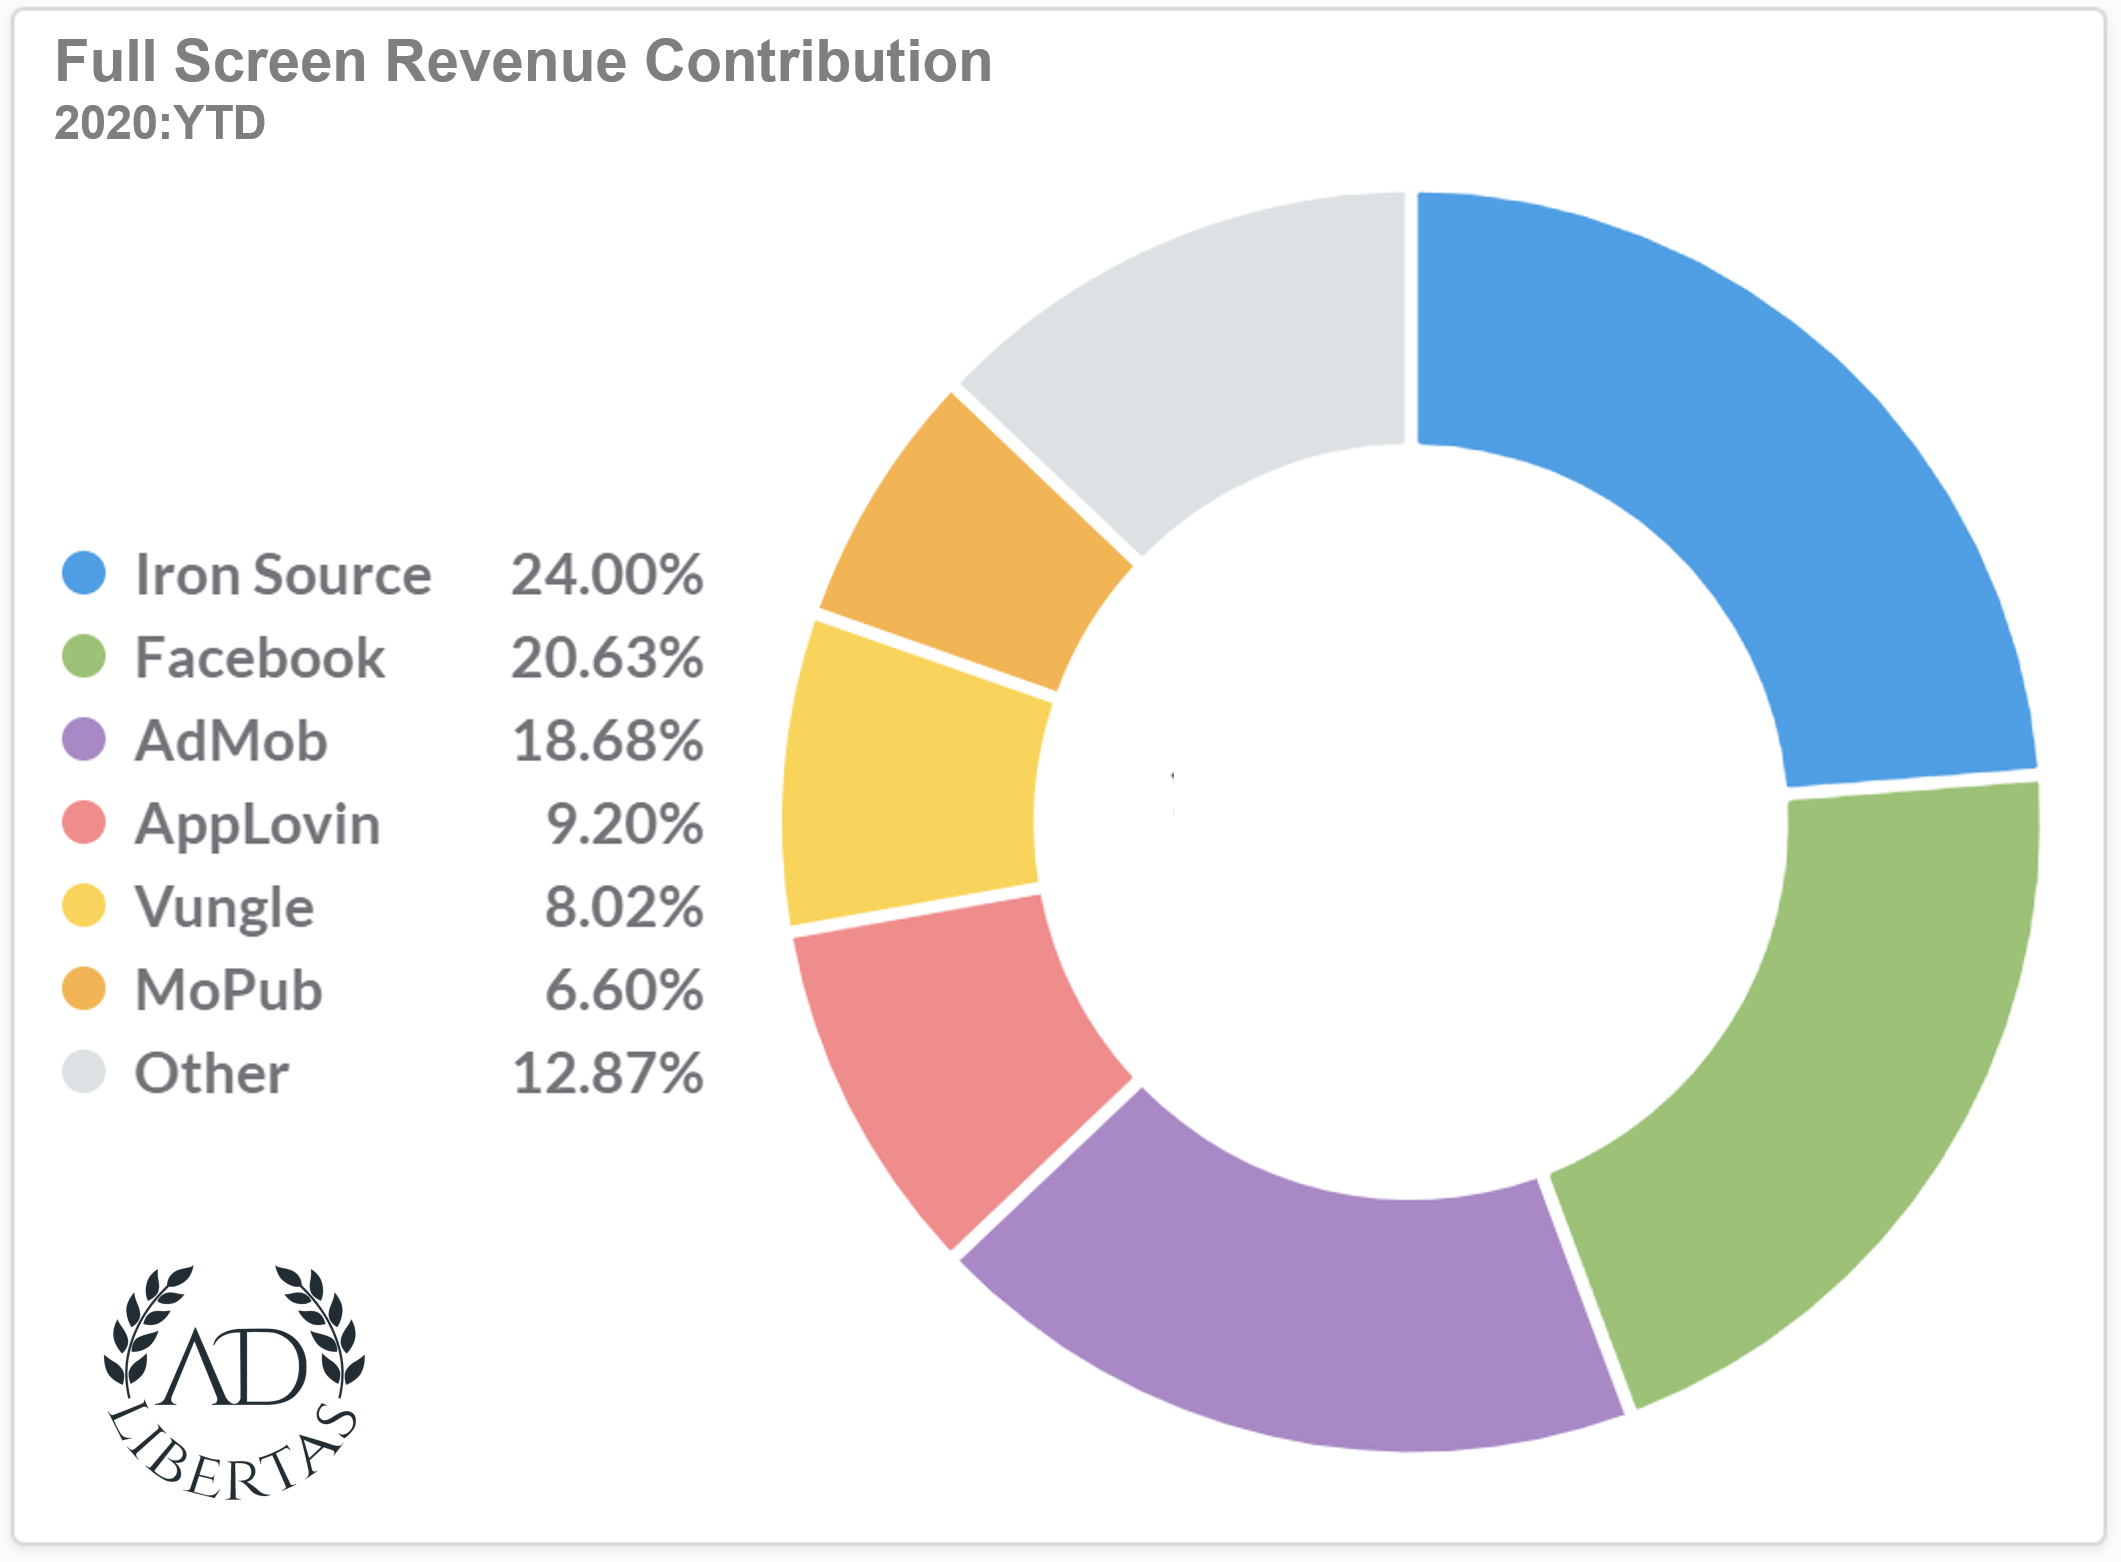
Full Screen Network Analysis
- ironSource made major gains in Q1, taking over top Full Screen revenue share in total revenue away from Facebook.
- Also ironSource was the only full screen network that consistently increased CPMs (and revenue contribution) through Q1, increasing rates 30% during the month of March.
- Meanwhile the downward trend on Facebook & Admob was somewhat more painful, down 40% from year-to-date highs. Since these two networks combined command 40% of total revenue earned, this is sure to hurt publishers after quarantine traffic levels return to normal.
Full screen summary: while increased usage is keeping the full screen market somewhat flat the CPMs are down drastically and when usage patterns fall the full screen performance will be sure to suffer.