In-App Ads Market Summary: Market Forces & Trends During a Period of Volatility
In-App Ads Market Summary: Market Forces & Trends During a Period of Volatility
Foreward:
Like many industries the global in-app ad market has been shifting in unprecedented ways over the last few weeks. The unique situations of the COVID-19 pandemic; the financial market plummeting; and the stay-at-home mandates put into place by many countries have had very unique effects on advertiser reactions. When coupled with more predictable forces— namely end-of-quarter— a lot of questions are left unanswered for app developers.
At AdLibertas we see many millions of daily impressions running on our publishers and a vast array of ad network partners’ buying patterns in all countries across the globe. Because of this unique view of aggregated demand and supply we’ve seen some interesting patterns that can help app developers react to this unique market situation.
How we categorized: Games v. Other
In analyzing the vast amount of data during the close of Q1, there existed one notable differentiation of behavior during this period. It wasn’t ad-type, platform or even geo. It was Game Developers vs. Other App Types. “Other” runs a pretty broad category, it spans everything from Utilities to Social apps, Audio to Reference. Normally these wouldn’t be appropriate groupings, but during this time period they are acting very similar at a high-level.*
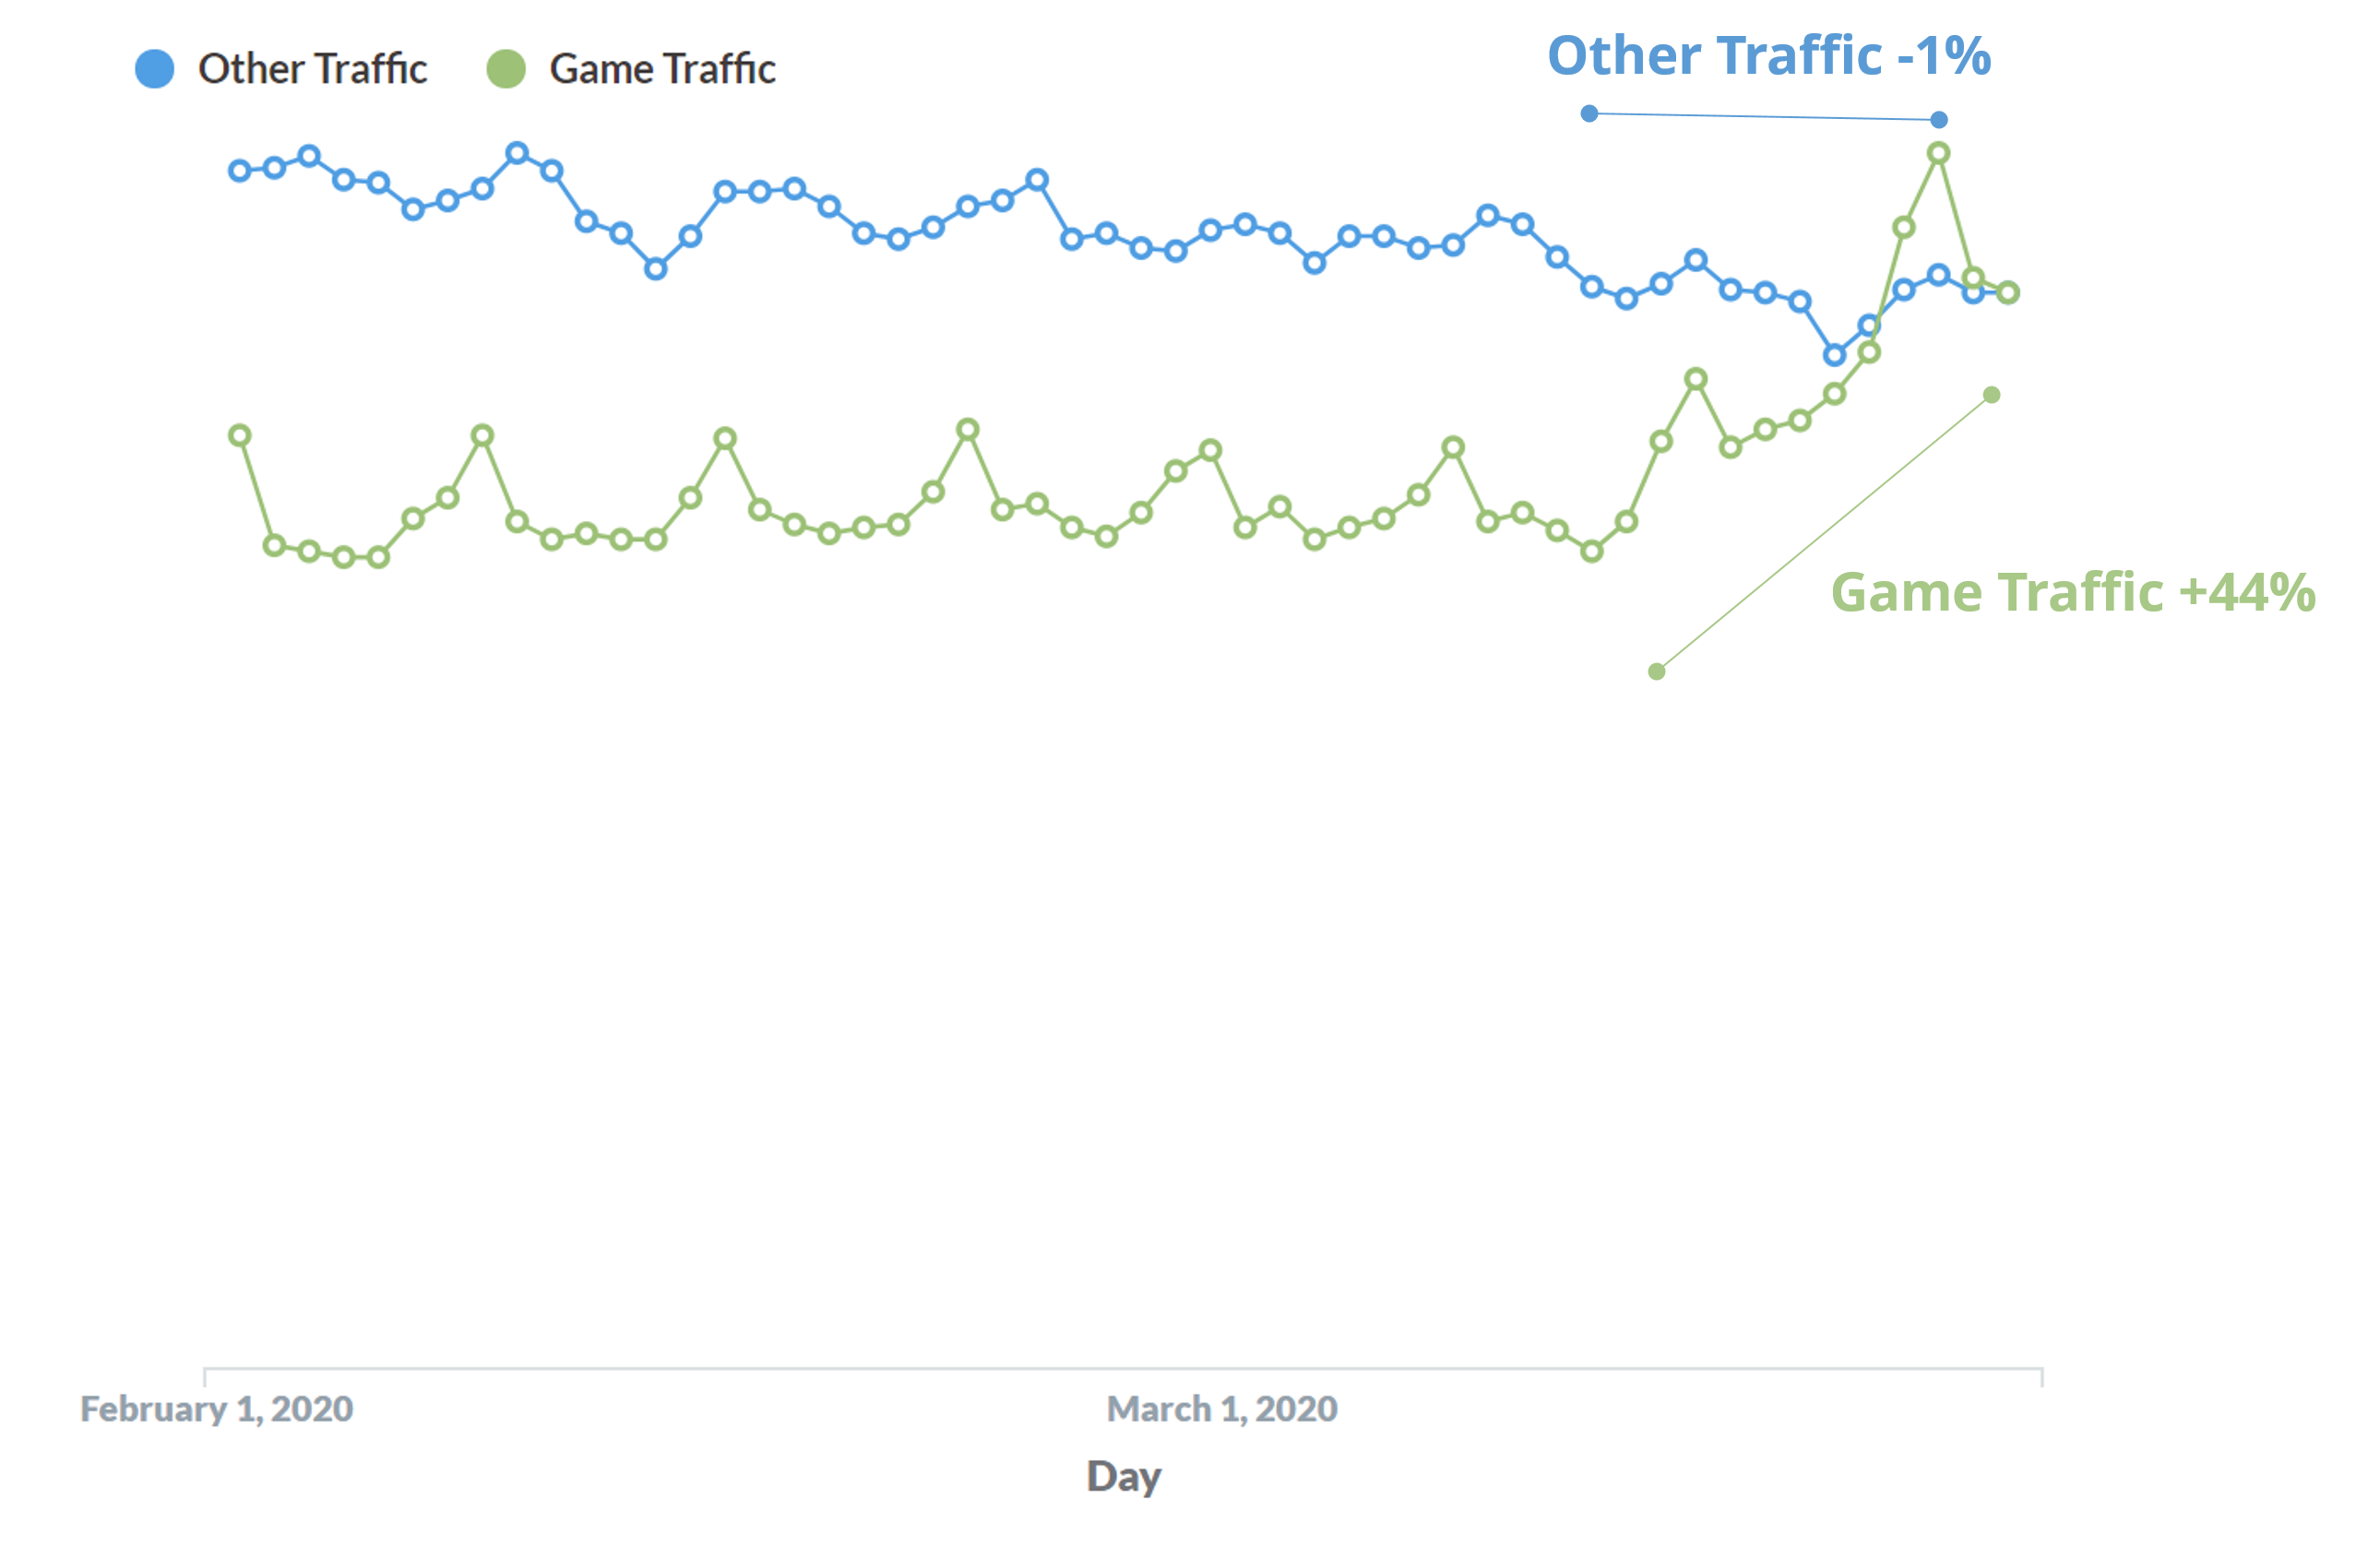
1. Usage: Game traffic is up. Way up.
Games are seeing a massive increase in traffic (impressions)—in what we can only assume is the result of more people spending more time on-screen looking for game entertainment. In less than 2 weeks we’ve seen a ~50% increase in traffic on game titles. Interestingly however the Other category remains flat – not every title was flat of course but the balance brings an almost 0% aggregated usage change during the same time period.
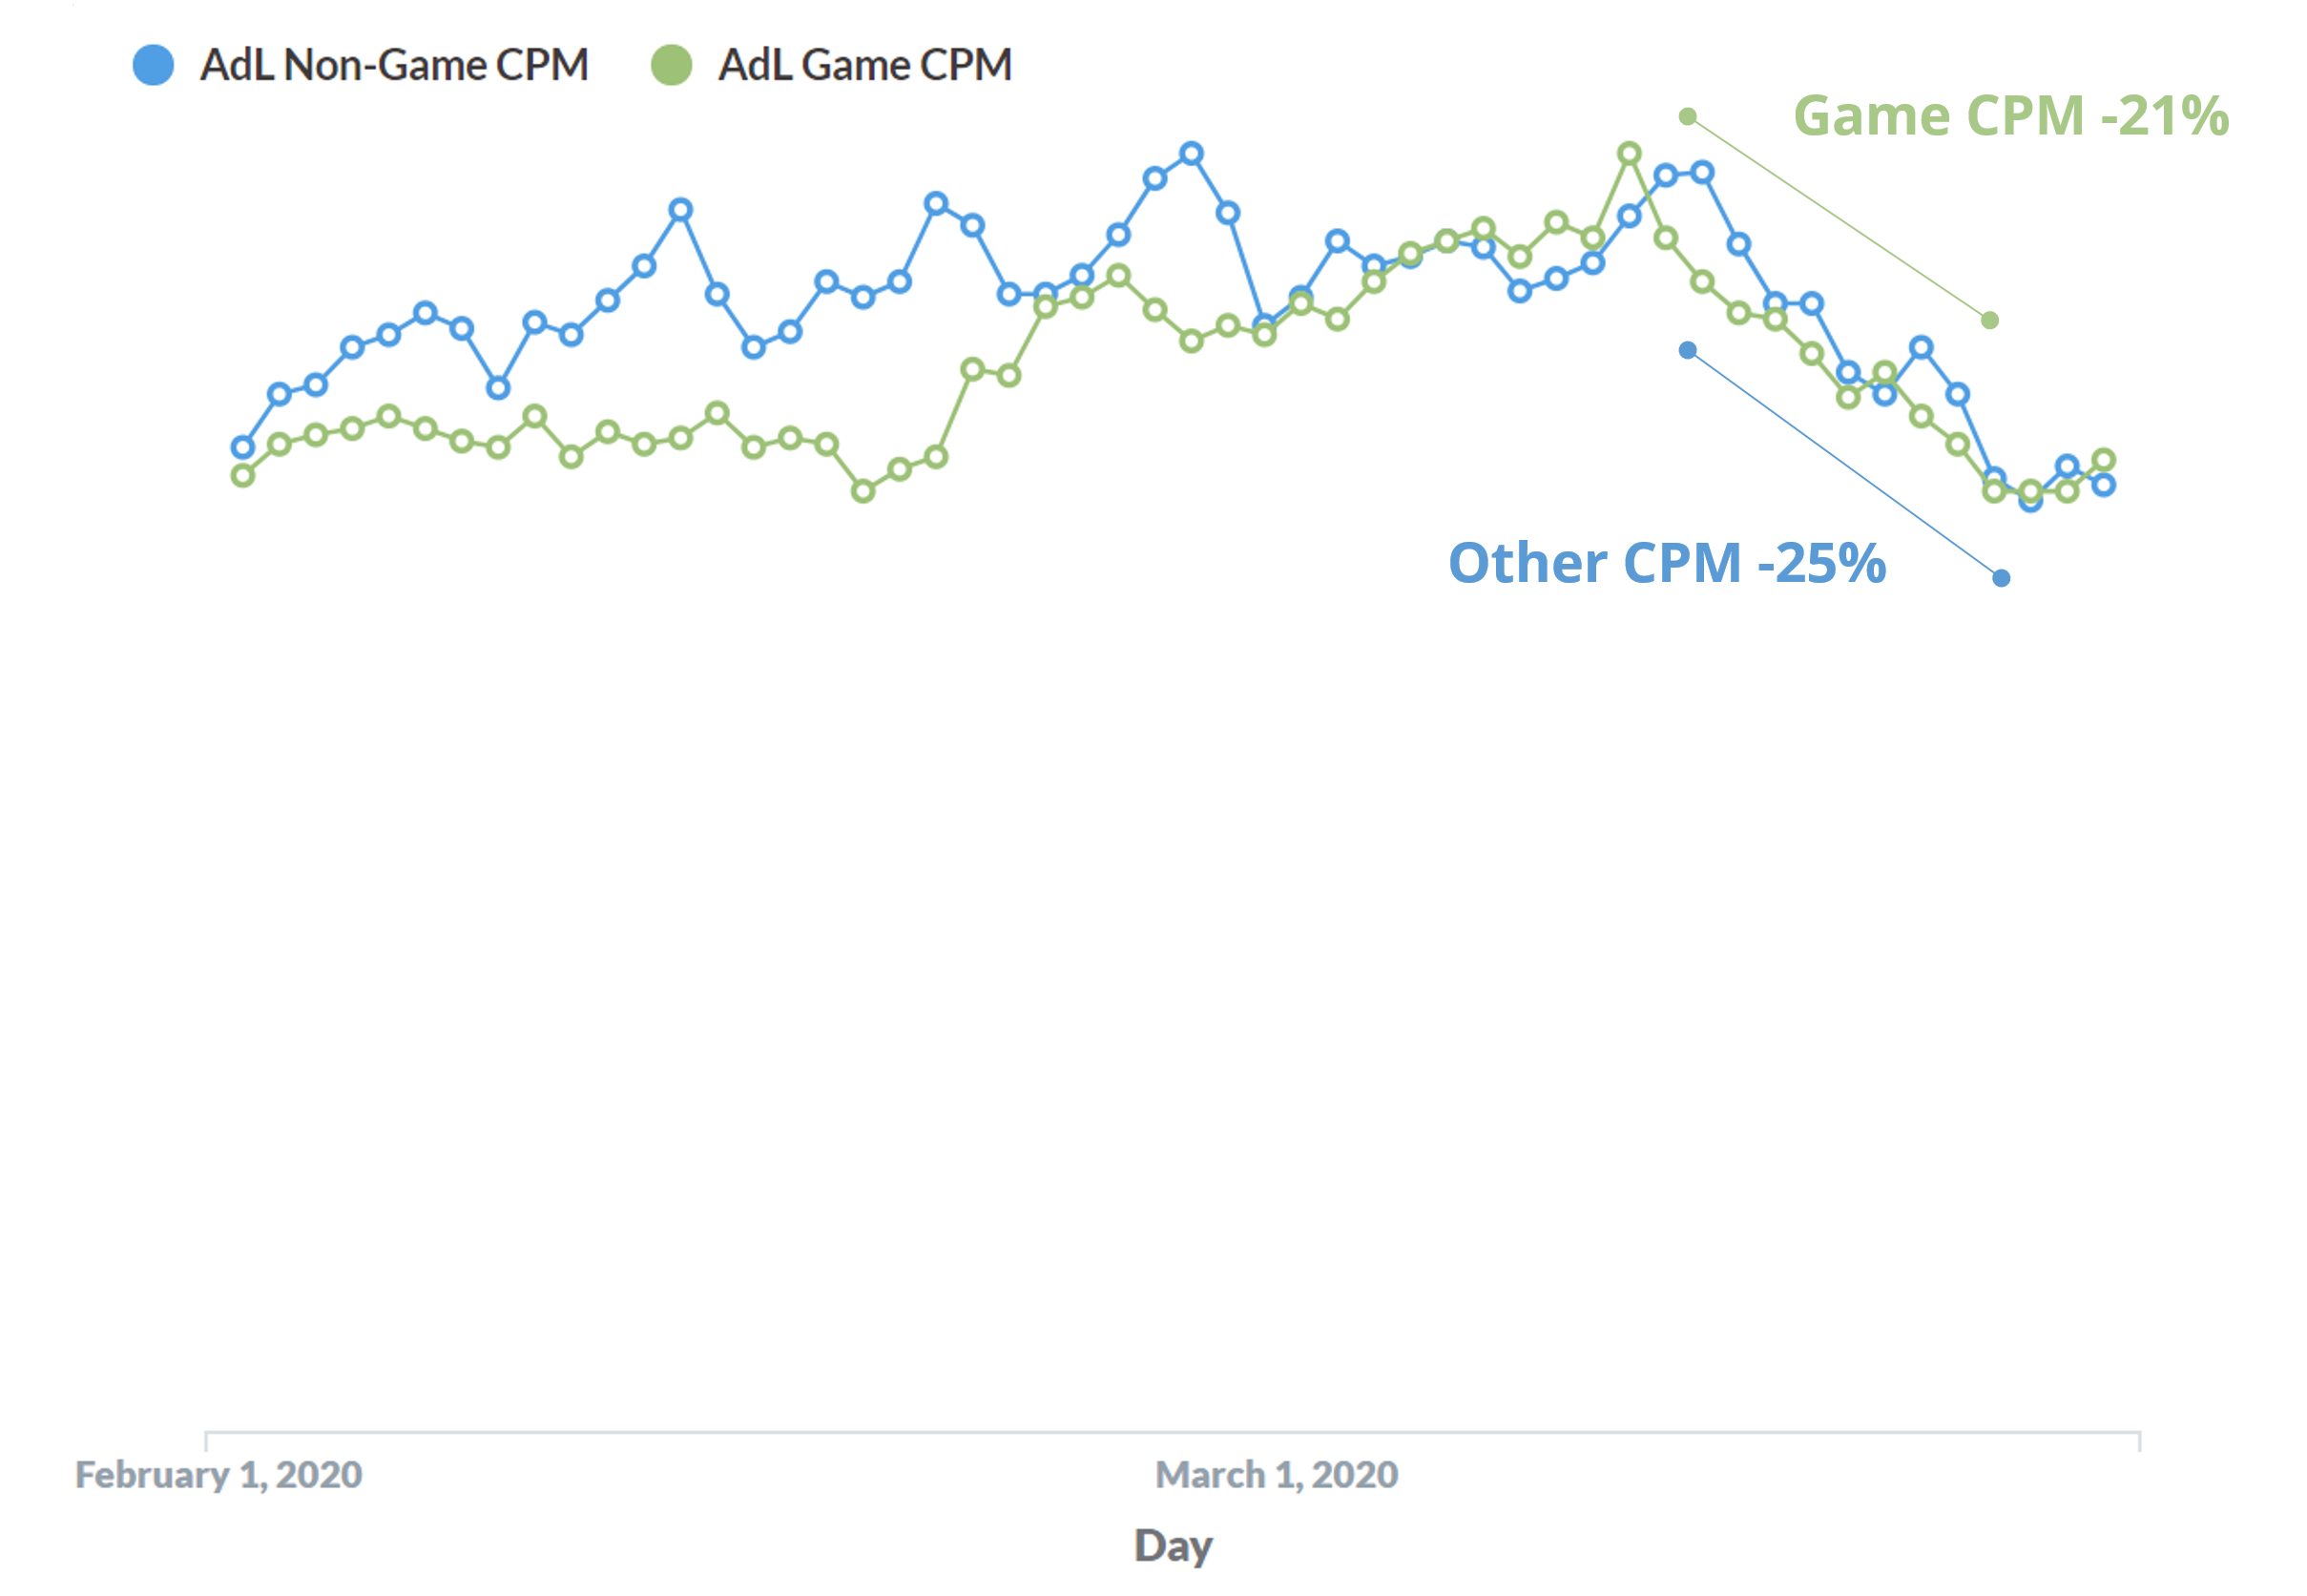
2. CPM: Overall, rates are down
We’ve seen a big decrease in advertising rates across the board. The hardest hit are networks boasting brand-dollars– who this time of the quarter are generally the cause of increased rates– are significantly down in overall spend, leading to aggregated lower rates. While overall CPMs are down universally, some networks are way up in overall spend—generally those with a performance focus—as performance budgets are scaling up as inventory is cheaper with less brand competition.
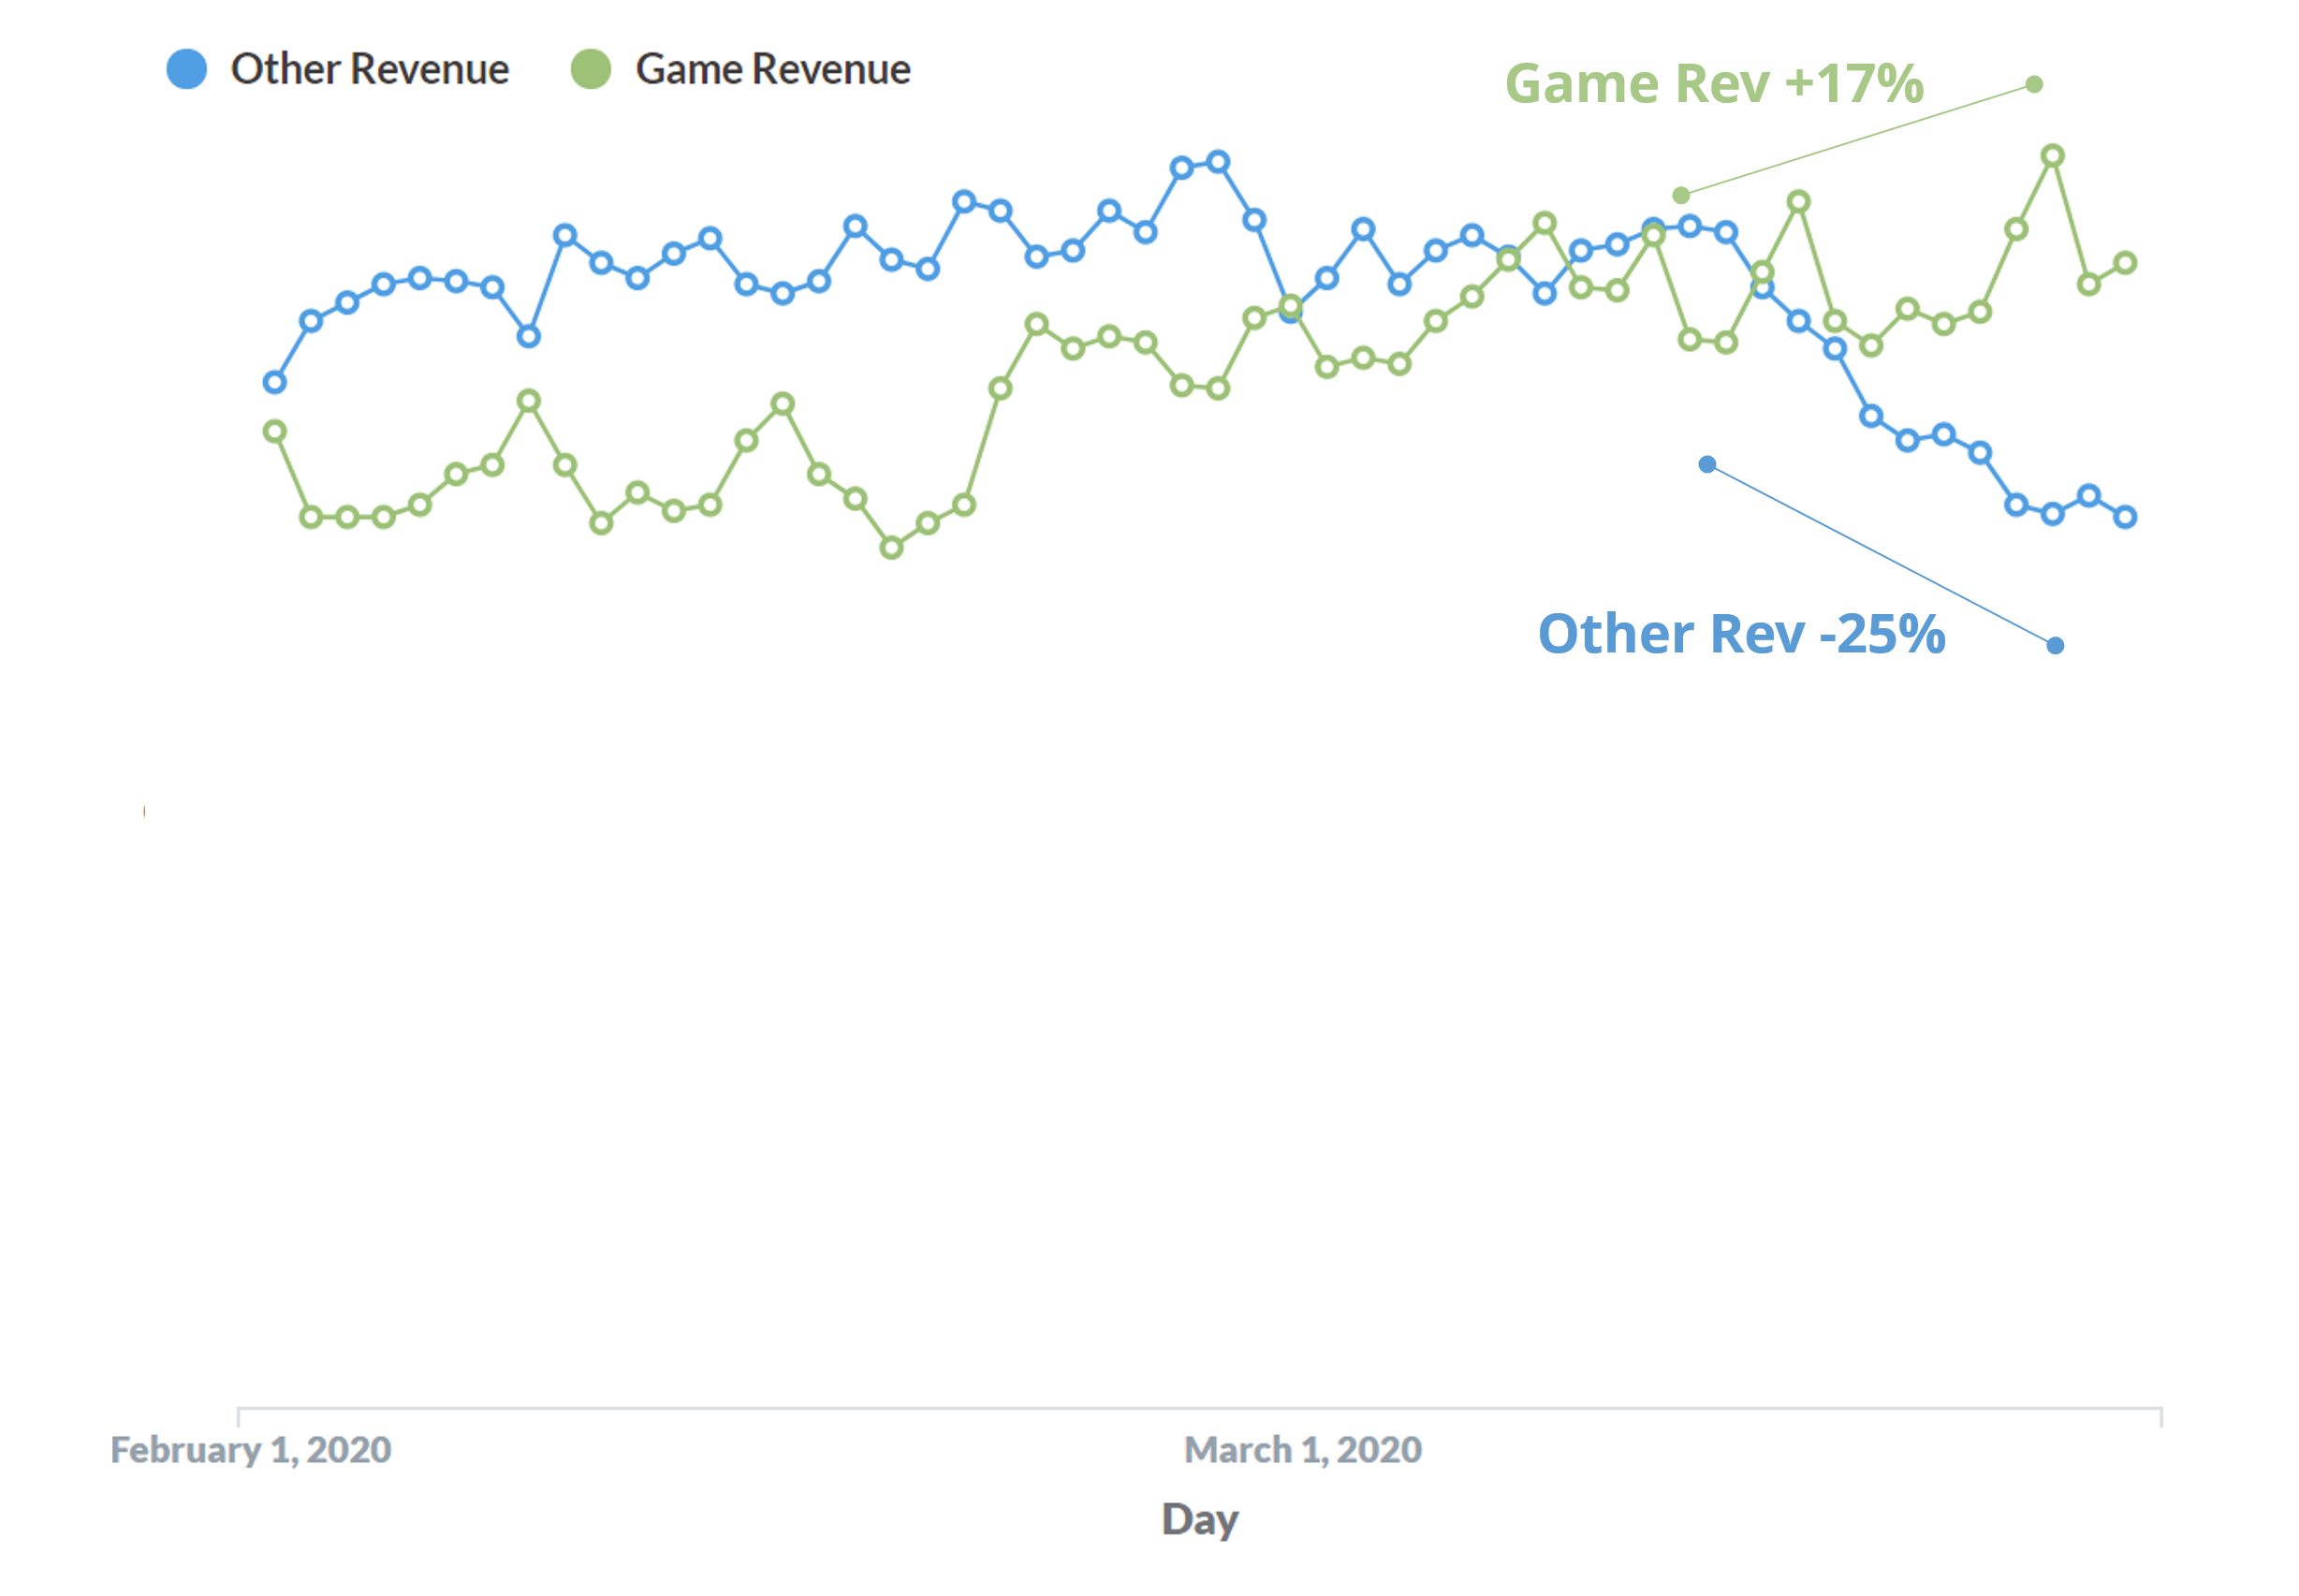
3. Revenue follows the eyeballs
Despite rates being down, game developers are still seeing an uptick in revenue because of the increased usage – their overall earnings represent a traditional quarter-end. Unfortunately non-games are seeing quite the opposite, flat usage following down rates are hurting earnings in the last month of Q1.
What is next?
As we enter an April of uncertainty we expect CPMs to continue to fall as we enter Q2, caused by 3 distinct factors:
1. Short-term cuts: brands will reduce ad budgets
Advertising budgets are one of the first places business cut when reducing capital expenditure. As brands plan for a down economy, we expect to see this reduction of budgets and rates trickle down to app developers.
2. Downward pressure: Relaxation of pricing pressure allows performance buyers to buy at lower rates
While today there is an uptick in spend volume because of lower rates, the lack of brand pricing pressure will allow a reduction of competitive pricing further. We expect overall performance to decrease as these market pressures are realized.
3. A Vicious Cycle: Lower CPMs will Lower LTVs will lower ROAS will lower CPMs
Many of the performance buyers are linked to earning ROI from ad earnings themselves. As global rates decrease, the overall earned revenue will decrease from at a user, level causing the performance advertiser in question to lower CPIs, lowering the overall earned CPMs.
*We heavily anonymize and index information processed and shown to remove any app outliers or skewed data sets.