Introducing User Report Filters: identify and understand your top-performing users
4:54s walkthrough with an example
We’ve recently launched the newest module for AdLibertas User Level Audience Reporting: User Report Filters. These filters allow our customers to segment chosen user groups by performance to help them understand the difference in the behavior of top and low revenue performers.
To help app developers better understand their users, we’ve created 4 types of filters based on the user’s financial performance (earnings) over time.
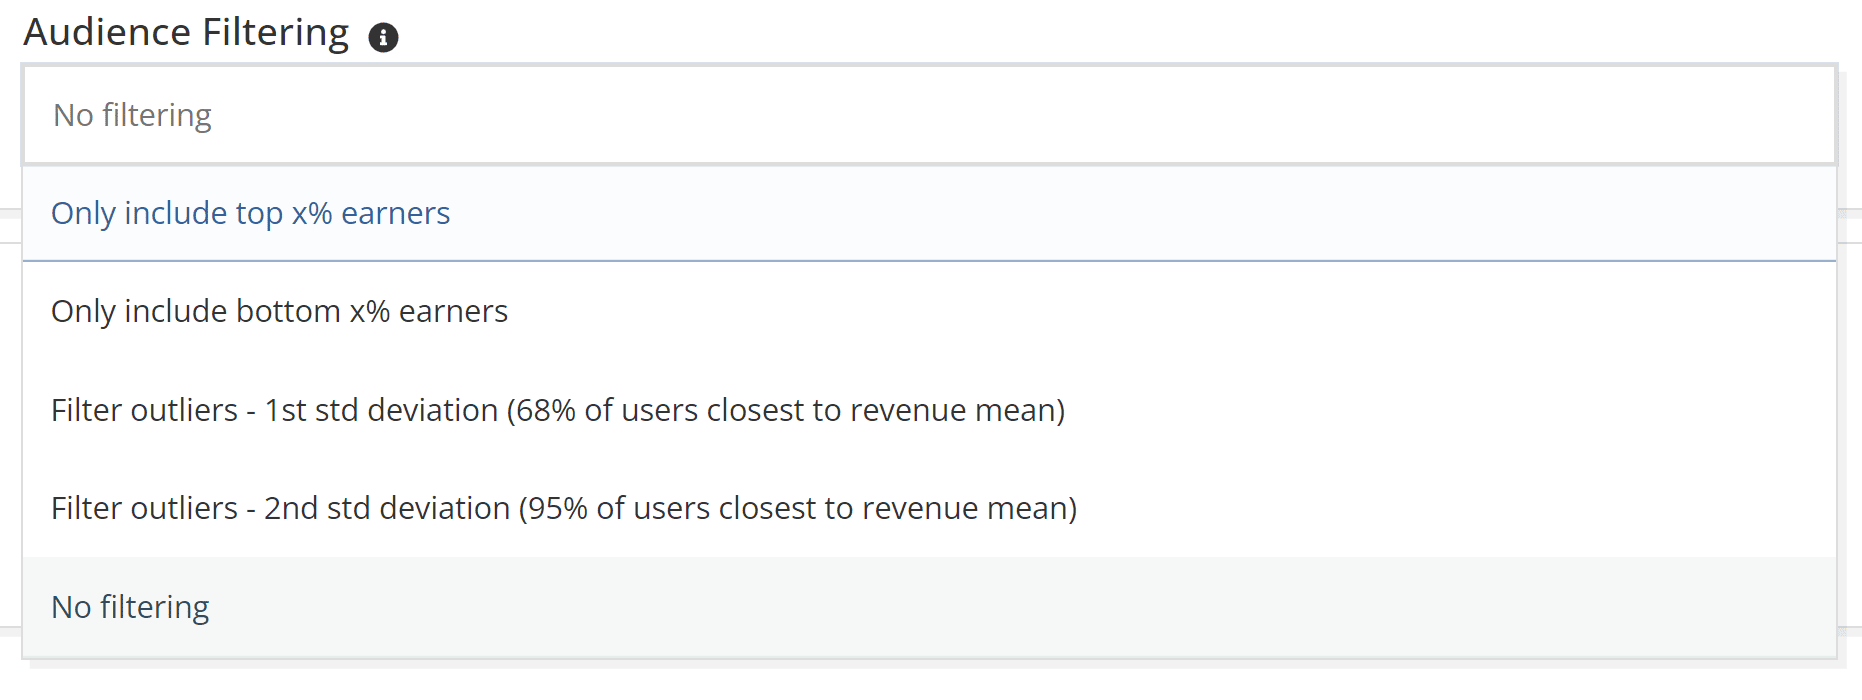
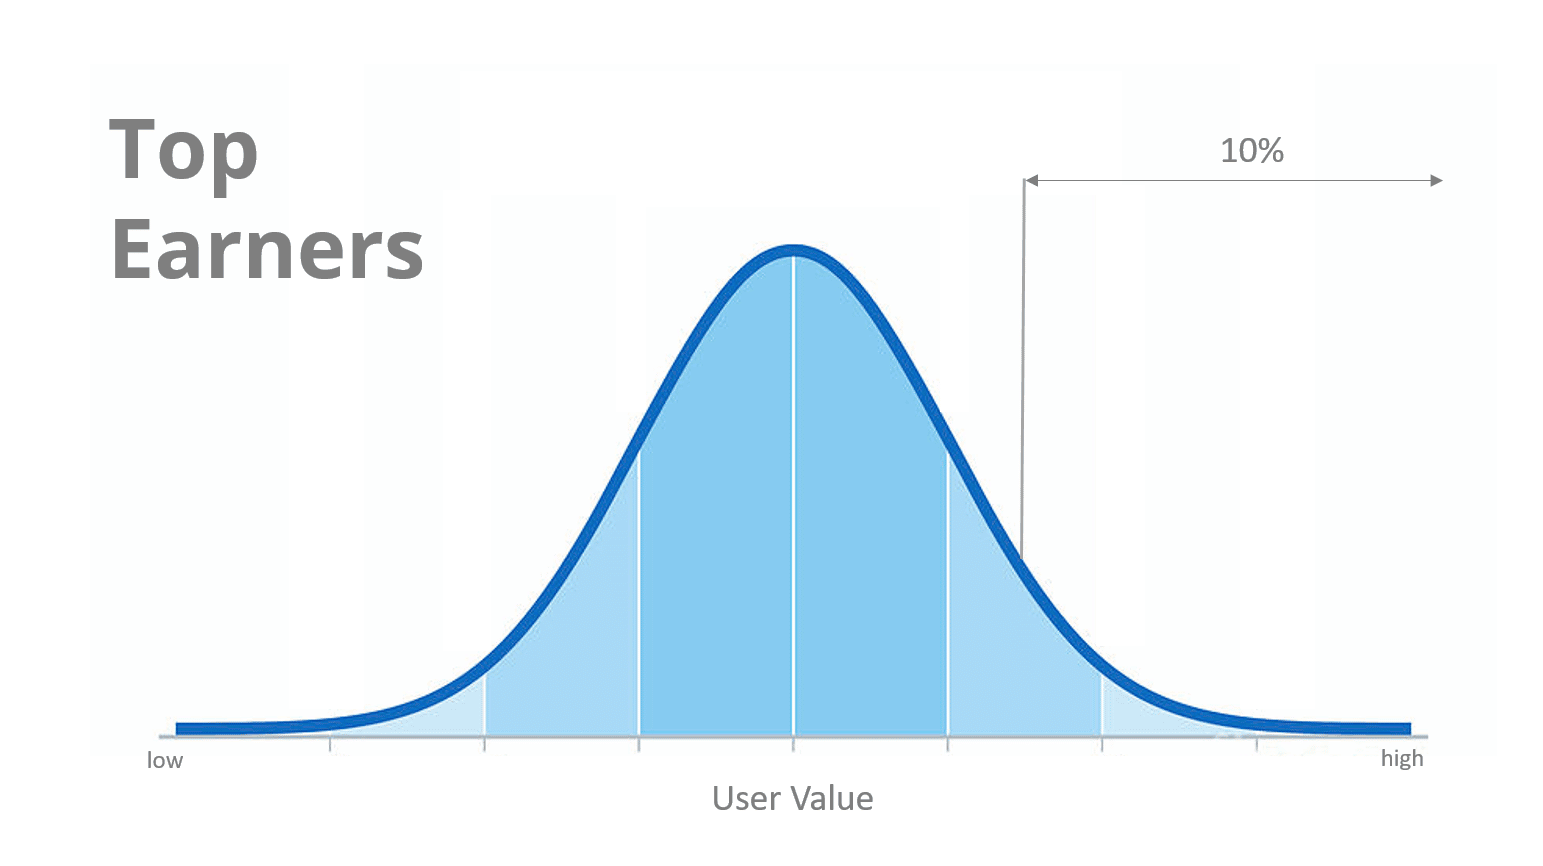
Top x% of users: This allows toggling between your chosen users and the top percentage of users. For instance, you can report on all installs in the US over the last 30days, then compare the performance and activity against the top 10%.
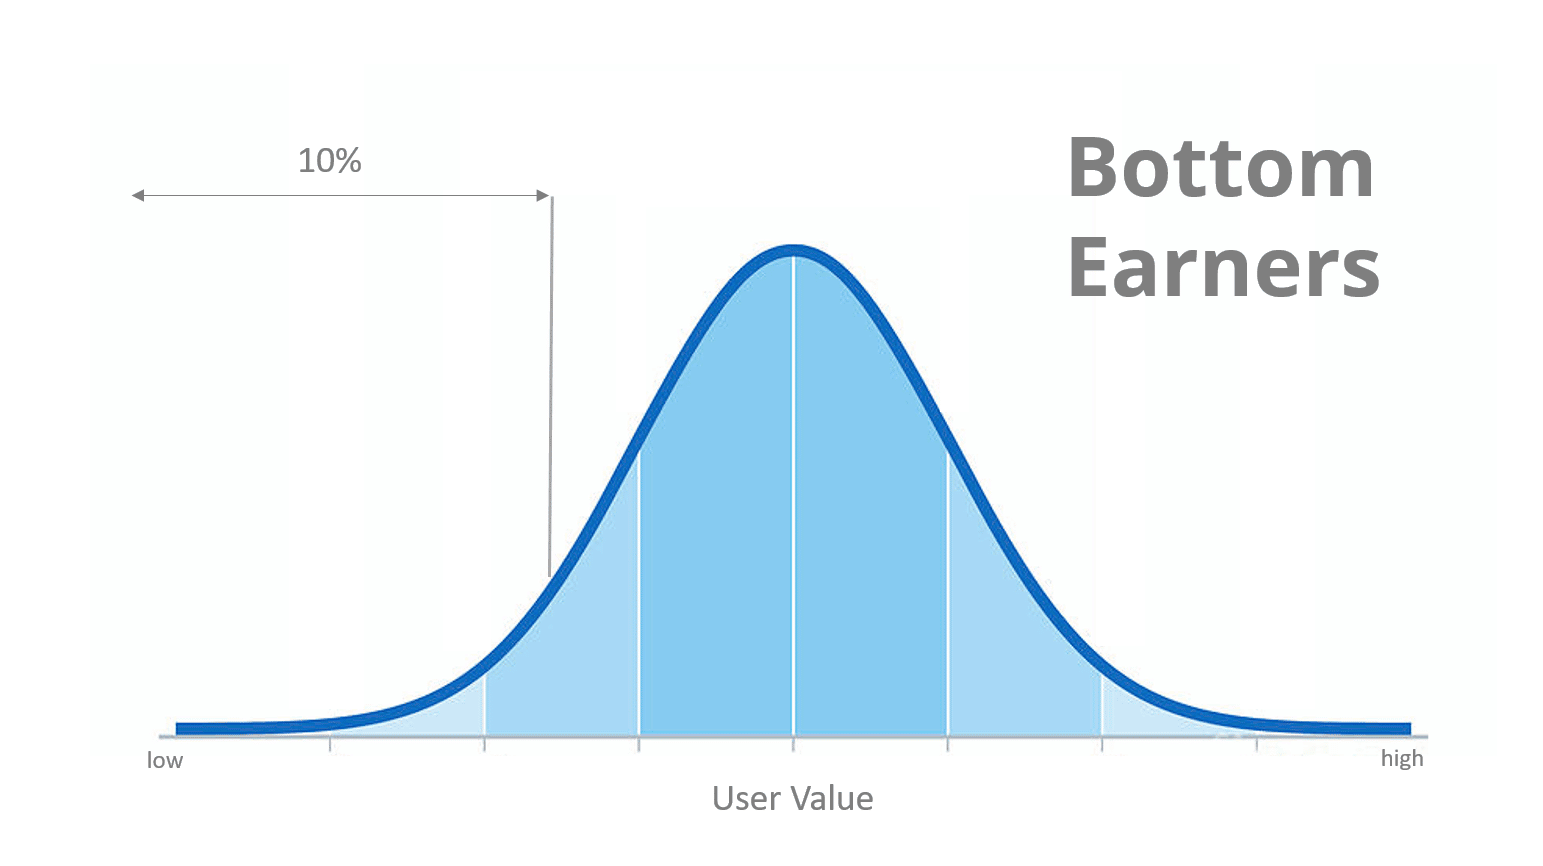
Bottom X% Users: This allows toggling to the lowest percentage of revenue-earning users. For example, you can report on all users who’ve achieved level 20, then compare activity against those users in the lowest-earning 10%.
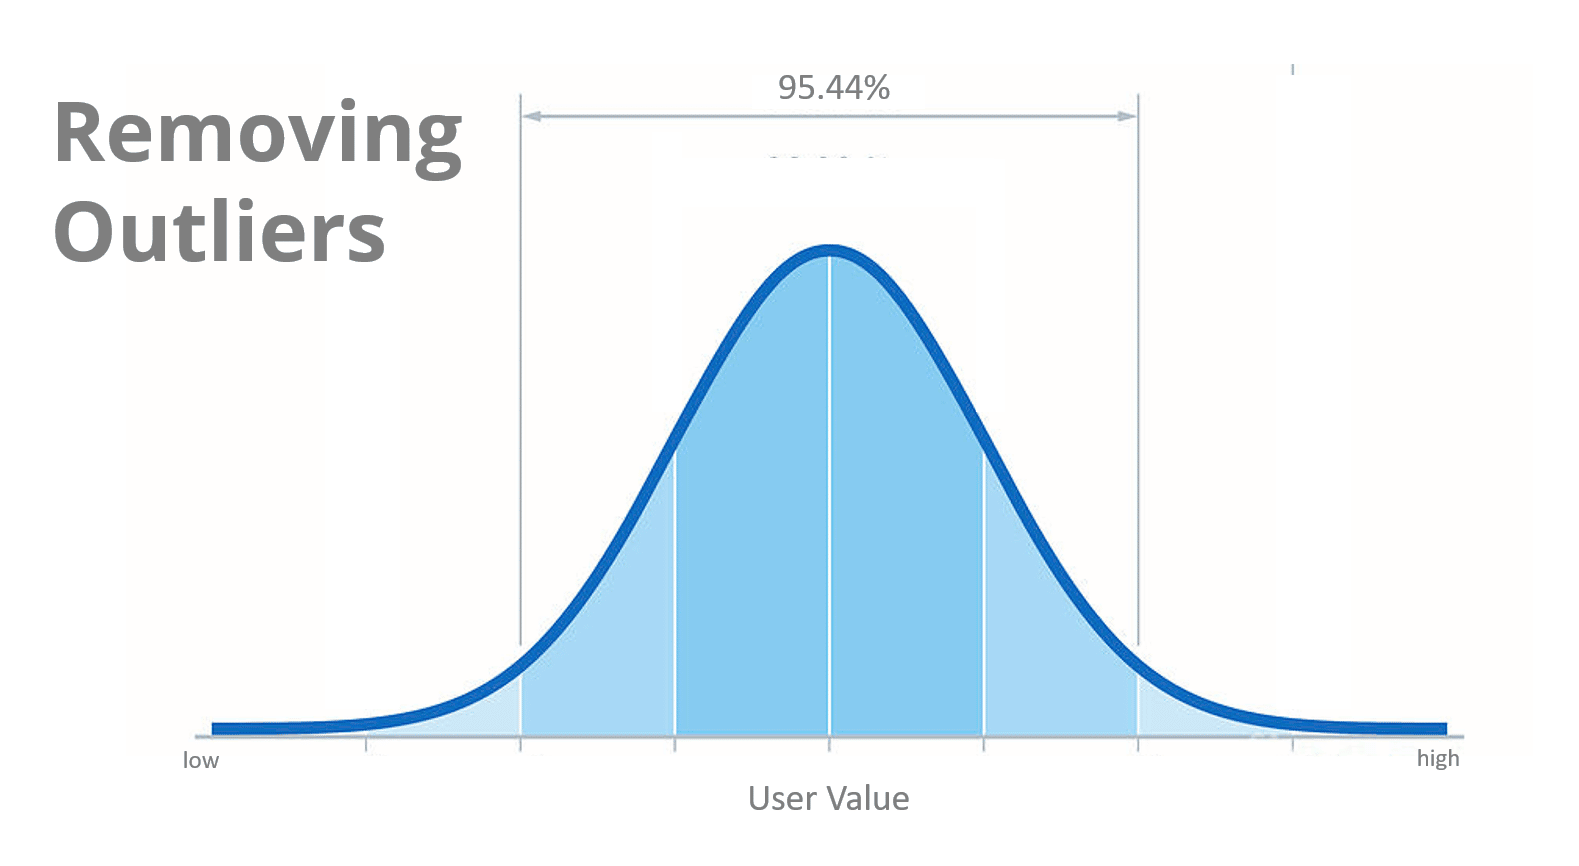
Filter to users in the 1st & 2nd Standard Deviation: This allows you to trim users that are outliers in their performance – specifically the top and bottom 22% and 2% respectively. For example, you could report on all installs from Applovin, then compare LTVs trimming out the top 2% of users.
How are Report Filters used?
While there are many use-cases for Report Filters, we’ve outlined a common use-case for each filter type:
Identify and understand your whales
For most apps, the top earners are extremely important. The percentage will range by the app but estimates generally agree that 70% or more of revenue is earned from a small number of users. As an app developer, you’ll undoubtedly want to know what portion of your revenue is earned by your top users and, more importantly, how to identify them early and create custom experiences to maximize their earning potential.
How much do these outliers impact your business?
In this example showing cumulative revenue, we see the top 10% of earners contribute 40% of the revenue earned in the first 15 days of the user lifetime.
How can you identify these high-performing users early?
When looking at the count of games played per user, we see the top 10% of users play 2.5+ more games than the average user.
Find the cause of user churn
High user churn is a bitter reality for most app developers. App developers are constantly iterating their app to increase early user engagement, understanding where and how users churn is an important part of making the app more effective. Using reporting filters is a method for tracking users who aren’t engaging with the app monetization and are at the bottom of the earning pool to understand where they fall off from the average user journey. Did they skip the tutorial, are they failing to complete the first level, do they get cannibalized by an ad?
Predicting users who will churn
The bottom 10% of users are almost 10X less likely to utilize the “hint” functionality on their first day.
Identifying engagement opportunities
The bottom 10% of users spend less than 5 min in the app on the first day when compared to the average of 17 minutes. Retention can be bolstered by focusing on engaging these targeted users during this time.
Get better predictions by removing outliers
A big part of turning an app into a successful business is predictably forecasting your earnings. Whether it be AB test outcome or campaign profit predictions, very often, app developers are making long-term predictions from as few users as possible. Since a few users can heavily sway predictions, a popular method for increasing predictability and relatability of forecasting is by removing extreme outliers on your audience. The most straightforward use-case is the 2nd standard deviation, where we remove the top and bottom 2.5% of users. When dealing with small sets of data, this increased confidence can help you more accurately use your sample to predict across large populations of users.
More accurate forecasting from a small sample size
Removing the top and bottom 2.5% of users (filtering to the 2nd standard deviation) both change the user’s earning projection model as well as cause the projected LTV to fall by 22%.
How it works:
See our documentation or walkthrough video to get more details on how you can add Report Filters to your reports.
Step 1.
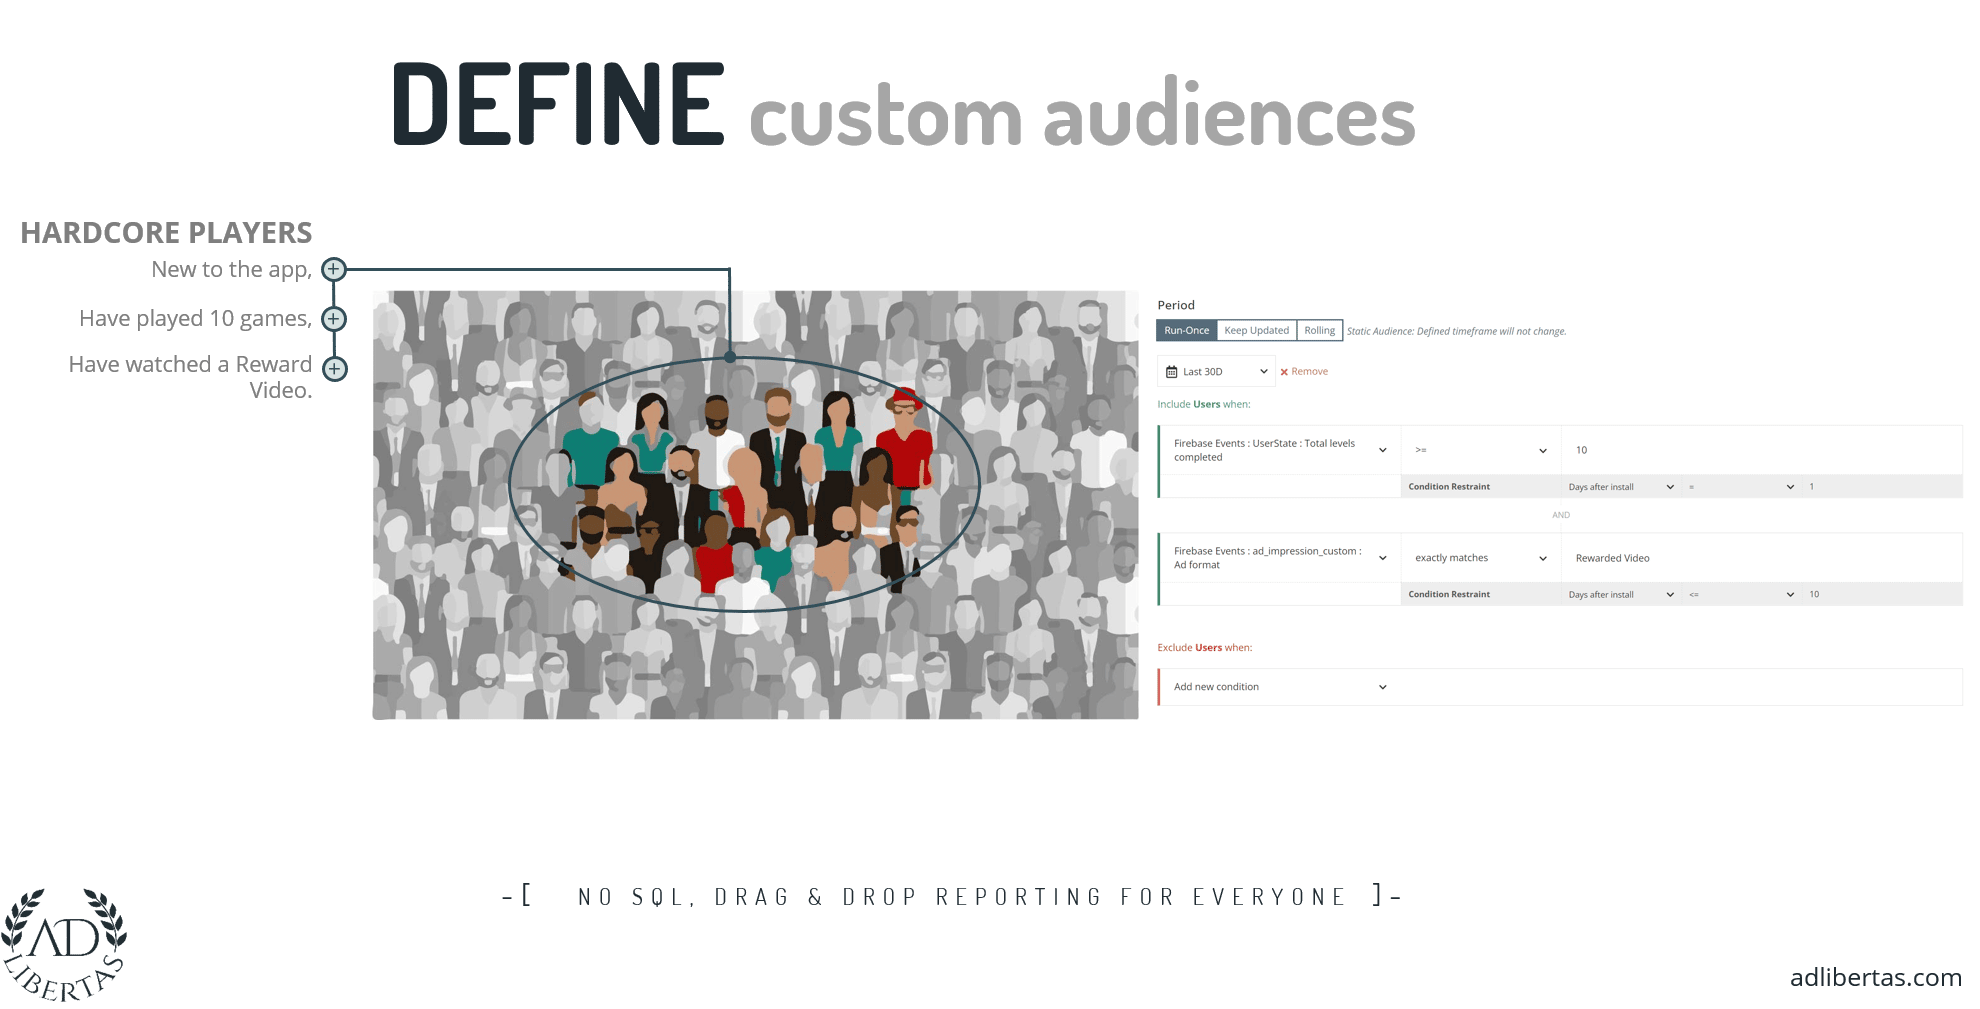
In the first step: create an audience by choosing targeted users, by characteristic, combination of events and/or behaviors.
In this example we define “Hardcore Players” as having completed 10+ levels on their first day have opted into at least one reward video within their first 10 days.
Step 2.
Second, you can construct reports to compare these audiences against each other over a variety of performance and usage metrics.
In this example, we outline the differing LTVs of users based on their day-1 activity.
Step 3.
Last you can compare users in your audience against the chosen filters based on user performance.
In this example we have added a filter that will toggle to the top 10% of earning users. In this real-world example the average pLTV for the top 10% is almost 10X the average user.
Making it work for your business
Data science and sophisticated statistical analysis isn’t out of reach for you. At AdLibertas we work with top app developers and tailor our platform and products to help turn mobile apps into successful, thriving businesses. Contact us for a demo on how we can help with your specific use case or would like to see how the platform works.


