End of Quarter Shuffle
End of Quarter Shuffle
Mid-year always brings exciting changes: skyrocketing highs from brand advertisers who need to accelerate to hit mid-year targets and the depressing lows as those budgets come to an end before starting anew for the second-half of the year. Meanwhile performance buyers– whose budgets are much more static– take advantage of the doldrums, often having their highest-spend days of the year before the market budgets come back into play.
It’s important to react quickly to market changes. We’ve designed pricing algorithms to quickly find and facilitate selling to higher priced buyers with extra dollars to spend during the mad Q-end rush, then quickly compensating when those budgets come to a crashing halt by swapping in performance buyers with fixed budgets.
We’ve taken the liberty of outlining the biggest 5 buyers at the end of Q2 to outline the CPM & revenue spends across their 10-day average to outline the biggest movers. You’ll notice performance buyers are scaling up (Applovin) while the heavy brand-focused networks (AOL) are coming down from sky-high spending at the end of the quarter.
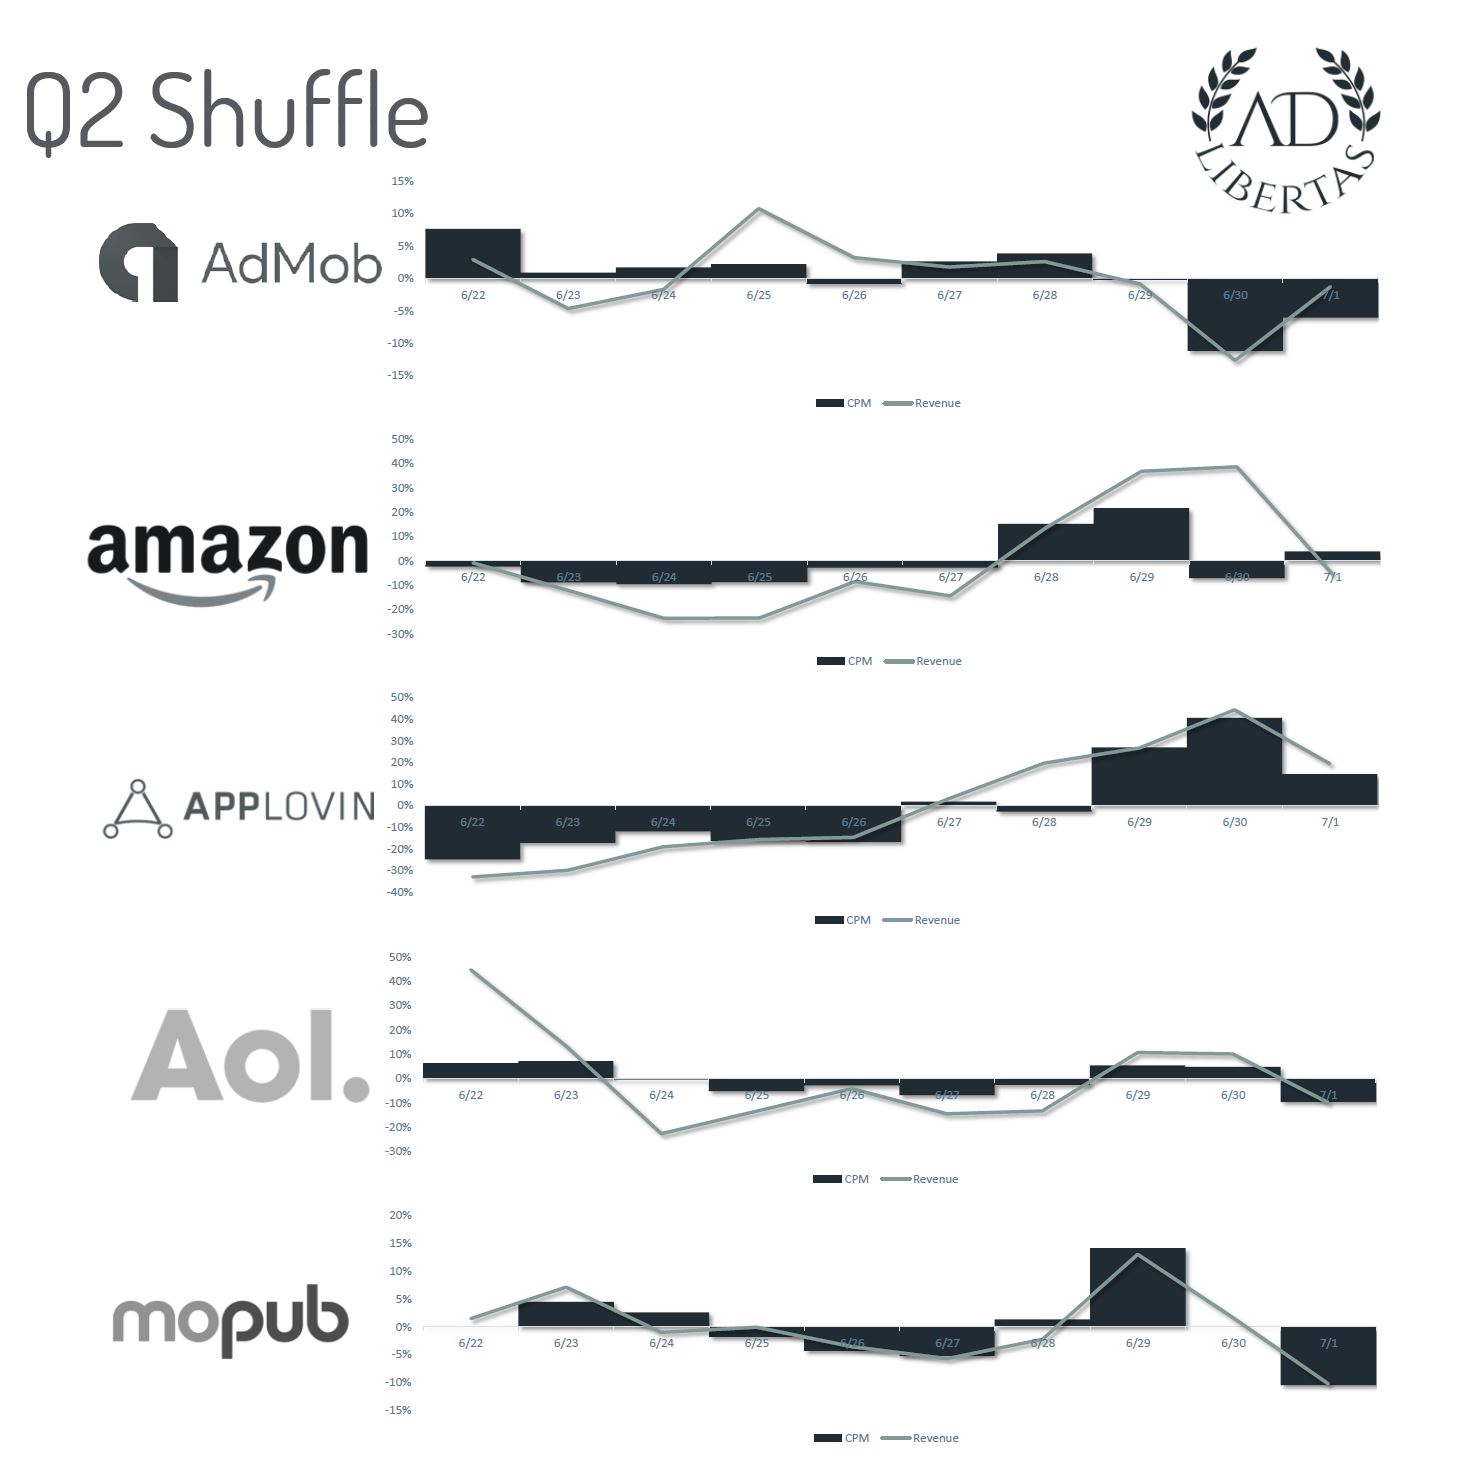
Line: represents daily compare of average spend during ten day period. Bar: CPM compare against 10-day average.
A downloadable pdf version is available here.